
SLIDE 1
06/08/2019 1
Eagle Cement Corporation
1H 2019 Analysts’ Briefing Presentation
06 August 2019
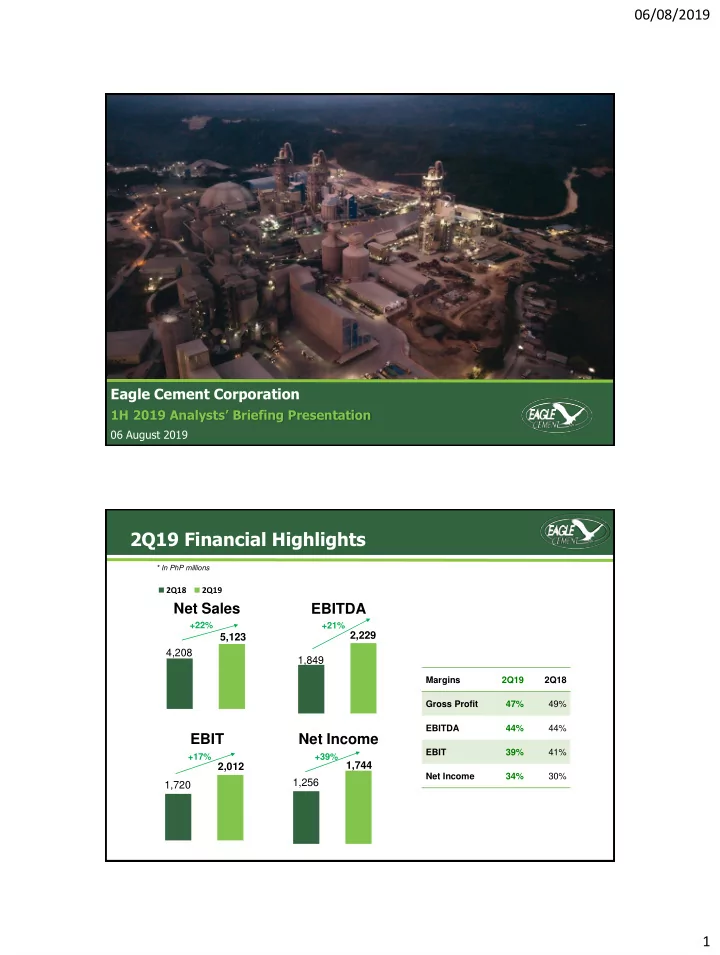
2Q19 Financial Highlights
1,849 2,229 4,208 5,123
2Q18 2Q19
* In PhP millions
Net Sales EBITDA EBIT Net Income
+22% Margins 2Q19 2Q18 Gross Profit 47% 49% EBITDA 44% 44% EBIT 39% 41% Net Income 34% 30%
1,720 2,012 1,256 1,744
+39% +17% +21%