
SLIDE 1
2011: Sector Leader of Building Materials & Fixtures 2011-2008: - - PowerPoint PPT Presentation
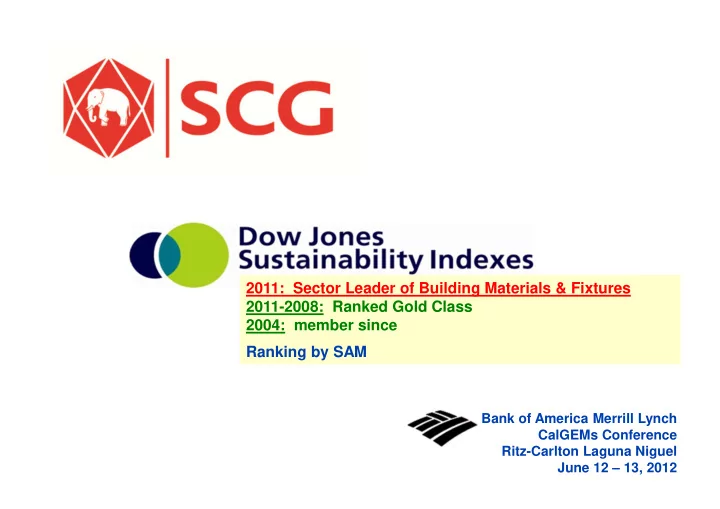
2011: Sector Leader of Building Materials & Fixtures 2011-2008: Ranked Gold Class 2004: member since Ranking by SAM Bank of America Merrill Lynch CalGEMs Conference Ritz-Carlton Laguna Niguel June 12 13, 2012 Agenda Slide 2
Slide 2
Slide 3
SCG Investment 1) dividend income (stake of <20%) 2) equity income (stake of 20% - 50%)
Chemicals Subsidiaries 12% Chemicals Equity Income 7%
Slide 4
Slide 5
Slide 6
Note: as of Apr/12
($1.8 Billion or 14% of total assets )
Slide 7
Note: as of May/12
Slide 8
Note: as of May/12
Slide 9
Slide 10
Note: figures for 2011
Slide 11
Slide 12
Slide 13
Slide 14
Slide 15
Location Start-up Stake Olefins Capacity SCG 28% (TPC 18%)
(Flex-feed cracker)
Ethylene Propylene Total
Thailand 1999 SCG 64% 800 400 1,200
Thailand 2010 SCG 67% 900 800 1,700
Indonesia 1995 SCG 30% 600 320 920 Existing Total 3,820
Location Start-up Stake Olefins Capacity (ton)
Vietnam 2017-2018 1,400
Slide 16
Note: as of Apr/12
Slide 17
Slide 18
Note: as of Apr/12
Slide 19
Note: Note: Note: Note: 301 scholarships are active, others have mostly retired Current 50 students (42 overseas): MBA 15, Engineering 32, Specialist 3
Slide 20
Slide 21
Slide 22
As of September 8, 2011
Universe Member Universe Member Universe Member Universe Member
Number of Companies
45 8 10 3 5 1 10 3
ASAHI GLASS CO LTD Japan BORAL LTD Australia CRH PLC Ireland HOLCIM LTD Switzerland LAFARGE SA France OWENS CORNING United States of America
SCG Thailand
TOTO LTD Japan WEYERHAEUSER CO United States of America
Company DJSI World DJSI Europe DJSI North America DJSI Asia/Pacific Industry Leader Country
Slide 23
Slide 24
Slide 25
‘000 tons
‘000 tons
‘000 tons
Slide 26
1994 1995 1996 1997 1998 1999 2000 2001 2002 2003 2004 2005 2006 2007 2008 2009 2010 2011 2012
Slide 27
Note: as of Jun/12, estimated by ground breaking basis
Slide 28
HD-Naphtha
Spread ($/T)
Note: SEA regional prices Conversion rate: 1 PE = 1 Ethylene
Slide 29
PP-Naphtha
717 691 650 535 408 515
Spread ($/ton)
649 PP Propylene Naphtha Q2/12 to date Q1/11
Q2/11 Q3/11 Q4/11 Q1/12
Note: SEA regional prices Conversion rate: 1 PP = 1 Propylene
Slide 30
PVC EDC Ethylene VCM
PVC-EDC/C2
323 437 444 406 424 489
Spread ($/ton)
403 Q2/12 to date
Q1/11 Q2/11 Q3/11 Q4/11 Q1/12
Note: FE regional prices Conversion rate: 1 PVC = 1 VCM = 0.8 EDC + 0.2 Ethylene
Slide 31
BZ-Naphtha
TL-Naphtha
BZ Spread ($/ton)
TL Spread ($/ton)
Note: SEA regional prices
Slide 32
Slide 33
Slide 34
1996 1997 1998 1999 2000 2001 2002 2003 2004 2005 2006 2007 2008 2009 2010 2011 2012
Million Ton
Industry Production 39.5 MT Industry Capacity 56MT Total Domestic Demand 28 MT Total Thai Export 11.5 MT
6% 11% 9% -2%
1% 10% 3% >5%
+75% Op Rate
Slide 35
1,000 1,500 2,000 2,500
Q1 Q2 Q3 Q4 Q1 Q2 Q3 Q4 Q1 Q2 Q3 Q4 Q1 Q2 Q3 Q4 Q1
Bagged Mixed Cement 32% Masonry Cement 5% Bulk Portland 51% Bagged Portland 12%
Slide 36
4.7 6.0 7.1 7.6 6.2 6.1 6.8 7.0 8.1 8.2 7.6 7.3 6.4 1.9
22 24 22 21 24 27 34 35 34 40 38 41 45 49
0.0 10.0 20.0 30.0 40.0 50.0
1999 2000 2001 2002 2003 2004 2005 2006 2007 2008 2009 2010 2011 Q1/12
Slide 37
Slide 38
Slide 39
Slide 40
Note: regional prices
Slide 41
Note: regional prices
Slide 42
Slide 43
Slide 44
28,584 33,704 50,359 46,936 49,380 43,246 34,206 44,046 41,943 40,838 9,835 1,834 3,484 4,267 6,571 7,771 6,762 4,577 3,070 4,006 5,415
Note: EBITDA includes dividend received
30,418 37,188 54,626 53,507 57,151 50,008 38,783 47,116 45,949 ($1.5 Bn) 46,253
466
10,301
+29% q-o-q
Slide 45
11,142 17,806 33,707 30,713 25,841 16,479 27,281 5,972 3,462 2,148 2,776 1,523 4,511 292 9,963
14,604 19,954 36,483 32,236 EPS 12.2 16.6 30.4 26.9 24.5 25.3 14.0 20.3 31.2 22.7 5.0 (Bt/sh) 29,451 30,352 16,771 27,419 24,346
37,382 27,281
+87% q-o-q
5,972
Slide 46
2,537 2,785 4,214 3,123 1,880 2,263 1,706 1,966 2,049 1,289
3,140 3,962 5,594 6,811 7,216 5,980 2,963 5,234 6,341 5,485 344
5,677 6,747 9,808 9,934 9,096 8,243 4,669 6,774 7,200 8,390 +184% q-o-q 213
Slide 47
1997 1998 1999 2000 2001 2002 2003 2004 2005 2006 2007 2008 2009 2010 2011 Q1/12
CAPEX = 146 Bn Baht CAPEX = 198 Bn Baht Net Debt 9.2 7.7 6.4 5.8 5.1 4.1 3.1 1.8 1.9 1.8 2.0 3.1 2.6 1.8 2.4 3.0
Slide 48
10 20 30 40 50 60 70
1997 1998 1999 2000 2001 2002 2003 2004 2005 2006 2007 2008 2009 2010 2011 Q1/12
2006-2010 = 146 Bn Baht 2011-Q1/12 = 52 Bn Baht
Past Phase Current Phase
Slide 49
(Capacity at year end = '000 tons) 2007 2008 2009 2010 2011 SCG Stake CAPEX (MB) Chemicals Upstream (Cracker) Cap Times Ethylene (subsidary) 800 800 800 1,700 1,700 900 2.1 x 45,600 MB Propylene (subsidary) 400 400 400 1,200 1,200 800 3.0 x ($1.2 Bill) Chemicals Downstream HDPE (subsidiary) 780 780 780 1,180 1,180 400 1.5 x 17,100 MB PP (subsidiary) 320 320 320 720 720 400 2.3 x ($450 mill) PVC (90% stake in TPC) 858 828 766 886 886 28 1.2 x 45% 2,200 MB LLDPE (Dow JV) 300 300 300 650 650 350 2.2 x 50% 2,100 MB Specialty Elastomers (Dow JV)
220
3,000 MB Propylene Oxide (Dow JV)
390
2,400 MB MMA (Mitsubishi Rayon JV) 85 85 85 175 175 90 2.1 x Cast Sheets (Mitsubishi Rayon JV)
20 20 20
Printing & Writing Paper 365 565 565 565 565 200 1.5 x 100% 7,300 MB Packaging Paper 1,660 1,660 1,880 1,880 1,880 220 1.1 x 70% 5,200 MB Box 550 637 692 741 795 245 1.4 x 70% 3,200 MB Cement Cambodia Grey Cement (MT) 23 24 24 24 24 1 1.04x 90% 3,000 MB Building Products Ceramic Tiles (M sqm) 95 122 122 122 149 54 1.6 x 54% to 100% 6,800 MB Ceiling & Wall product (M sqm) 34 50 57 57 65 31 1.9 x 100% 3,200 MB Lightweight concrete (M sqm) 3 3 3 15 15 12 4.0 x 68% 1,600 MB 47% 2,500 MB Total Cap 2007 - 2011 67% 100% Increase Project Cost
Apr start Oct start
Slide 50
(MB) 2006 2007 2008 2009 2010 2006 - 2010 2011 Q1/12 2011 - 2015 EBITDA 57,151 50,008 38,783 47,116 45,949 239,007 46,253 10,301 Profit for the Period 29,451 30,352 16,771 24,346 37,382 138,302 27,281 5,972 CAPEX & Investment 23,574 27,160 42,379 34,535 18,378 146,026 32,053 20,025 Dividend Paid 18,000 18,000 9,000 10,200 15,000 70,200 15,000
4,036 5,898 4,562 5,168 13,959 33,623 7,504 1,264 Finance Costs 5,169 5,273 6,089 5,649 4,670 26,850 6,048 1,242
Slide 51
16,000 25,000 25,000 15,000 25,000 40,000 30,000 15,000 25,000 25,000 10,000 20,000 30,000 40,000 50,000 2007 2008 2009 2010 2011 2012 2013 2014 2015 2016
Slide 52
0.0 0.0 0.0 0.0 1.0 1.0 1.0 1.0 3.0 3.0 3.0 3.0 6.0 6.0 6.0 6.0 15.0 15.0 15.0 15.0 15.0 15.0 15.0 15.0 15.0 15.0 15.0 15.0 15.0 15.0 15.0 15.0 7.5 7.5 7.5 7.5 8.5 8.5 8.5 8.5 12.5 12.5 12.5 12.5 12.5 12.5 12.5 12.5
0.0 2.0 4.0 6.0 8.0 10.0 12.0 14.0 16.0 2000 2001 2002 2003 2004 2005 2006 2007 2008 2009 2010 2011
% of Net Profit 0% 16% 25% 36% 49% 56% 61% 59% 54% 42% 40% 55%
Slide 53
Slide 54
Slide 55
Slide 56
(NVDR 11%)
(Foreign Board 25%)
Slide 57
1913 – 1970’s 1970’s - 1980’s 1980’s - 1990’s
Cement Construction Materials Steel Ceramics Paper & Packaging Chemicals Automotive Electrical
1998 - 2003
2004 - onwards
Slide 58
Chemicals - Naphtha Cracker (consolidated) Chemicals - Associates (equity accounting) Ethylene 1,700,000 tons Dow Chemicals JV (50%) Propylene 1,200,000 tons
650,000 tons Chemicals - Downstream (consolidated)
390,000 tons HDPE 1,180,000 tons
220,000 tons LDPE + LLDPE 200,000 tons
120,000 tons PP 720,000 tons
300,000 tons PVC (Thai, Indo, Viet) 886,000 tons
18,000 tons Mitsui Chemicals JV (20% - 50%) Cement (consolidated)
1,440,000 tons Grey Cement (Thai, Camb) 24 million tons
100,000 tons Ready-Mixed Concrete 22 million metre
3 - PP Compound (46%)
86,000 tons (Thai, camb, Myan, Indo, Laos, Viet)
15,000 tons White Cement (Thai, Viet) 0.4 million tons Mitsubishi Rayon JV (47%)
175,000 tons Building Products (consolidated)
20,000 tons Ceramic Tiles (Thai, Indo, Phil) 149 M sqm Chandra Asri JV(30%) Roofing Tiles (Thai, Cam, Phil, Viet) 87 M sqm
600,000 tons Ceiling & Wall Products 65 M sqm
320,000 tons Autoclaved Lightweight Concrete 15 M sqm
320,000 tons
480,000 tons Paper (consolidated)
340,000 tons Packaging Paper (Thai, Phil, Viet) 1.88 million tons Bangkok Synthetic (26%) Box (Thai, Malay, Sing, Viet) 795,000 tons
140,000 tons Printing & Writing Paper 565,000 tons
50,000 tons Short Fibre Pulp 425,000 tons
70,000 tons
Slide 59
Slide 60
Slide 61
Slide 62
Slide 63
Siam Kubota Leasing Siam Kubota Metal Tech
Siam Toyota Manufacturing (4%)
Slide 64
Slide 65
2,773 3,441 3,722 4,228 2,038 1,703 1,560 428 527 727 567 698 2,752 971 445 466 2,000 4,000 6,000 8,000 Q1/10 Q2/10 Q3/10 Q4/10 Q1/11 Q2/11 Q3/11 Q4/11 Q1/12
EBITDA Margin
10% 9% 9% 7% 9% 4% 3% 3% 1%
Note: EBITDA = EBITDA from operations + dividend from associated companies
4,429
Dividend from associates EBITDA from subsidiaries EBITDA
3,300 4,168 4,289 4,267 4,926 4,789 2,674 2,005
1,636 2,631
894
Slide 66
Divestment Gain Equity Income from Assc. Subsidiaries Profit
Slide 67
EBITDA 26% 22% 21% 20% 26% 25% 23% 19% 24% margin 22% 24%
+4% y-o-y +60% q-o-q
+12% y-o-y +108% q-o-q
Slide 68
2,424 2,630 2,403 1,672 2,547 2,350 2,348 1,566 2,215 974 1,170 931 415 1,054 1,007 918 352 1,010
Q1/10 Q2/10 Q3/10 Q4/10 Q1/11 Q2/11 Q3/11 Q4/11 Q1/12
All 19% 21% 18% 13% 19% 18% 16% 12% 16% Packaging 16% 17% 14% 11% 17% 15% 14% 11% 15% P&W 25% 28% 26% 16% 22% 22% 21% 14% 17% EBITDA
+41% q-o-q Net Profit
Slide 69
Sales (MB) 2008 2009 2010 2011 Q1/12 Assets (MB) 2008 2009 2010 2011 Q1/12 Consolidated 293,230 238,664 301,323 368,579 102,884 Consolidated 285,776 315,986 359,219 374,653 386,780 Chemicals 136,527 101,115 144,317 192,929 52,900 Chemicals 138,504 165,947 165,087 176,614 183,098 Paper 47,110 42,729 51,714 54,839 13,985 Paper 51,089 48,271 50,127 52,542 54,223 Cement 49,999 46,661 48,954 54,249 16,091 Cement 60,770 60,680 61,018 60,180 66,960 Building Materials 23,351 26,873 30,719 34,171 10,315 Building Materials 22,654 22,992 24,796 35,804 39,858 EBITDA (MB) 2008 2009 2010 2011 Q1/12
Profit for the Period (MB)
2008 2009 2010 2011 Q1/12 Consolidated 38,783 47,116 45,949 46,253 10,301 Consolidated 16,771 24,346 37,382 27,281 5,972 Chemicals 12,598 19,482 16,024 14,394 894 Chemicals 6,136 12,556 22,609 11,190 1,240 Paper 6,660 7,901 9,129 8,811 2,215 Paper 1,658 2,286 3,490 3,331 1,010 Cement 11,272 11,616 10,810 12,781 3,915 Cement 6,006 6,214 6,014 7,288 2,519 Building Materials 4,085 4,907 5,489 5,060 1,917 Building Materials 778 1,617 1,872 1,476 893 EBITDA Margin (%) 2008 2009 2010 2011 Q1/12 EBITDA / Assets (%) 2008 2009 2010 2011 Q1/12 Consolidated 12% 18% 14% 11% 10% Consolidated 14% 15% 13% 12% 11% Chemicals 7% 17% 9% 5% 1% Chemicals 9% 12% 12% 8% 2% Paper 14% 18% 18% 16% 16% Paper 13% 16% 16% 17% 16% Cement 23% 25% 22% 24% 24% Cement 19% 19% 19% 21% 23% Building Materials 16% 18% 17% 14% 19% Building Materials 18% 21% 20% 14% 19%