2005 results Palais Brongniart, 30 March 2006 1906-2006: 100 years - - PowerPoint PPT Presentation

2005 results
SMART_READER_LITE
LIVE PREVIEW

2005 results Palais Brongniart, 30 March 2006 1906-2006: 100 years - - PowerPoint PPT Presentation

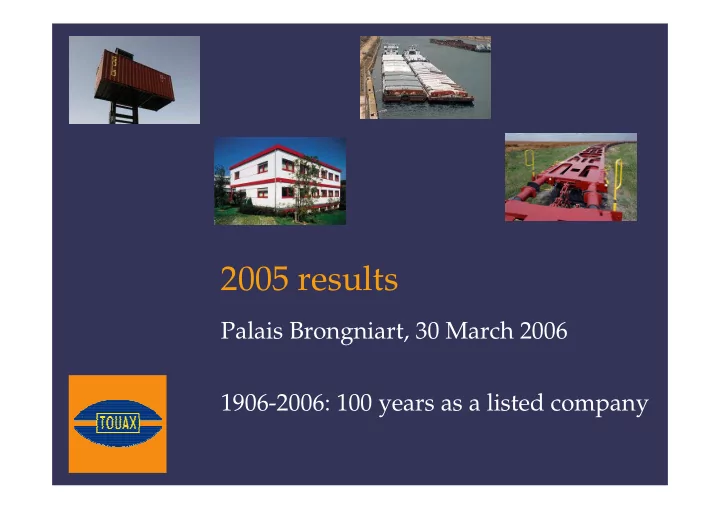
2005 results Palais Brongniart, 30 March 2006 1906-2006: 100 years as a listed company Contents Presentation of the company Highlights of 2005 Results and financing Strategy and targets Touax and the stock market Presentation of the


slide-1
SLIDE 1

2005 results

Palais Brongniart, 30 March 2006 1906-2006: 100 years as a listed company

slide-2
SLIDE 2

Contents

Presentation of the company Highlights of 2005 Results and financing Strategy and targets Touax and the stock market

slide-3
SLIDE 3

Presentation of the company

slide-4
SLIDE 4

The TOUAX Group

Your operational leasing solution

Shipping containers 52% Modular buildings 20% River barges 14% Railcars 14%

Europe (excl. France) 33% Franc e United States 5% International (sh

BREAKDOWN OF 2005 REVENUES By activity By geographic region 2005 REVENUES: €222 million, +23% A team of 350 professionals across 11 countries (Europe, Americas and Asia)

slide-5
SLIDE 5

Presentation of activities

Touax’s growth is based on a simple concept:

  • Companies are increasingly outsourcing the
  • wnership of their non-strategic assets.
  • The advantages of operational leasing:
  • Flexible contract (short to long term)
  • No investment required by the lessee
  • Subcontracting of maintenance (included in lease)
  • Rapid availability
  • Touax: a preferred partner for businesses
slide-6
SLIDE 6

Presentation of activities

A single leasing strategy encompassing four product lines

Leasing of standardized mobile equipment:

  • Low risk of obsolescence
  • Long service life (15 to 50 years)
  • High residual value in a liquid global market for

secondhand equipment

  • Mobility allows optimization of utilization rate
  • Mainly long-term contracts ensuring recurring cash flow
slide-7
SLIDE 7

Presentation of activities

Shipping containers

  • 2nd in continental Europe and 10th in the world

(source: Containerisation International)

  • Leasing of standard dry containers (20’ and 40’) mainly

under long-term contracts

(81% at 3/5 years as at end of 2005)

  • The strengths of Touax:
  • A fleet of modern, high-quality equipment (average age < 4 years)
  • A dynamic sales force
  • A presence in 40 countries (8 branches, 4 offices and 150 depots)
  • More than 100 shipping lines use our services, including 22 of the

top 25 (Maersk Lines, Evergreen, MSC, China Shipping, CMA-CGM, etc.)

slide-8
SLIDE 8

Présentation des activités

Conteneurs Maritimes

slide-9
SLIDE 9

Presentation of activities

Shipping containers: growth of the

fleet managed by Touax

  • 25,000

75,000 125,000 175,000 225,000 275,000 1997 1998 1999 2000 2001 2002 2003 2004 2005

Number of containers (TEU size) man

Growth of international trade: the global container fleet has grown from 8.8 million to 20.8 million units (TEU size) in 10 years

Average annual growth of Touax: +26.38% Average annual growth of the market: +10.1%

slide-10
SLIDE 10

Presentation of activities

Shipping containers: outlook

  • The growth of maritime transport is favorable for leasing
  • Source: Clarkson Research Studies – March 2006 & Containerisation International 2005
  • Outlook for 2006
  • A more difficult year for shipowners, which will favor leasing.
  • Continuation of investments in long-term contracts
  • Investment in excess of $50,000,000
  • Medium-term outlook
  • Fleet size > 500,000 TEU (5% global market share)

+7% +9% +10% +9% +6% +4% +10% Container fleet +10% +11% 2005 +13% +8% +7% +8% +8% +8% Container vessels +2% 2001 +10% 2002 +11% 2003 2006 2004 2000 +10% +14% +11% Containerized traffic

slide-11
SLIDE 11

Presentation of activities

Modular buildings

  • 3rd largest lessor in Europe and 6th largest in the world

(source Touax)

  • Activity: leasing, lease-purchase, sale
  • The strengths of Touax:
  • A range of standardized, high-quality equipment for varied

uses (offices, schools, hospitals, storage, etc.)

  • A presence in Europe (6 countries) and the United States
  • A diversified customer base:

⋅ Industries (ST Microelectronics, British Petroleum, Sanofi,

Madrid Health Institute, etc.)

⋅ Central/local government (regional authorities,

municipalities, etc.)

⋅ Building & public works (Bouygues, Hoechtief, FCC, etc.)

slide-12
SLIDE 12

Présentation des activités

Constructions Modulaires

slide-13
SLIDE 13

Presentation of activities

Modular buildings: growth of the fleet managed

by Touax

  • The European fleet of leased modular buildings has

grown from 225,000 to 450,000 units in 15 years (source

Touax)

  • 2005 marks a recovery in investments
  • 5,000

10,000 15,000 20,000 25,000 1997 1998 1999 2000 2001 2002 2003 2004 2005

  • Average annual growth
  • f Touax:

+14.02% Average annual growth

  • f the market:

+4.7%

slide-14
SLIDE 14

Presentation of activities

Modular buildings: outlook

  • Outlook for 2006
  • In Europe

⋅ Strong progress in Spain and Poland ⋅ Recovery expected in France, in Germany and Benelux

  • In the United States (Florida, Georgia)

⋅ Development of public authority business and sales

  • Medium-term outlook
  • In Europe

⋅ Market share target of 10% (5% in 2005), i.e. around 50,000 modules

  • In the United States

⋅ Development in the south-east of the USA with public authorities

slide-15
SLIDE 15

Presentation of activities

River barges

  • Largest barge fleet in Europe for “dry” bulk goods (coal,

grain, ore, fertilizer, cement, etc.) source: Touax

  • Main activities: transport, chartering, leasing
  • The strengths of Touax:
  • Unique experience of international operation
  • A presence in the main European river basins: Rhine, Main,

Meuse, Moselle, Danube, Seine, Rhône, Garonne

  • Activity in the United States: Mississippi
  • Customer base comprising major industrial and transport
  • perators (Cargill, Dreyfus, Lafarge, Electrabel, DSM, CFT, Miller, etc.)
  • Experience going back more than 150 years
slide-16
SLIDE 16

Présentation des activités

Barges Fluviales

slide-17
SLIDE 17

Presentation of activities

River barges: growth of the fleet managed by

Touax

  • The number of river barges in Europe has remained unchanged for

several years, leading to an ageing of the fleet (source Touax). In the USA, the number of barges for dry bulk goods fell from 19,677 units in 2001 to 18,279 units in 2004, 1/3 of which are more than 25 years old (source Sparks Companies Inc).

  • 1997

1998 1999 2000 2001 2002 2003 2004 2005

  • Average annual

growth of Touax: +2.19% Average annual growth of the market: +0%

slide-18
SLIDE 18

Presentation of activities

River barges: outlook

  • Outlook for 2006
  • Strong activity on the Mississippi and the Danube
  • Medium-term outlook
  • Positioning in and development of long-term leasing and

transport contracts

  • Selective new investments under consideration
slide-19
SLIDE 19

Presentation of activities

Railcars

  • 2nd largest European lessor of intermodal railcars
  • 7th largest lessor of hopper cars in the USA in

partnership with CFCL

  • Long-term leasing of:
  • Container railcars
  • Auto carrier railcars
  • Hopper cars and dry bulk goods cars for the transporting of

heavy goods (cement, grain, etc.)

  • The strengths of Touax:
  • Services that meet customers’ expectations in a context of rail

freight liberalization in Europe.

  • Modern railcars meeting the needs of fleet renewal
  • Average lease term > 5 years
  • Customer base comprising large railway groups (SNCF, SNCB,

CFF, private operators, etc.) and industrial groups (Cargill, Lafarge, US Salt, Gefco, etc.).

slide-20
SLIDE 20

Présentation des activités

Wagons

slide-21
SLIDE 21

Presentation of activities

Railcars: growth of the fleet managed by Touax

  • The number of semitrailers, swap bodies and containers transported by rail in

Europe rose from 5,105,758 TEU in 2001 to 5,389,484 TEU in 2004 (Source: International Union of Combined Road-Rail Transport Companies)

  • Rail operators are enthusiastic about the leasing services provided by Touax
  • Average annual

growth of Touax: +26.15% Average annual growth of the market: +2%

Number of platforms

slide-22
SLIDE 22

Presentation of activities

Railcars: outlook

  • Outlook for 2006
  • Investment in excess of €40 million under long-term contracts

in Europe and the United States

  • Medium-term outlook
  • Managed fleet of 10,000 railcars
  • Consolidation of our position as the 2nd largest European

lessor of intermodal railcars

slide-23
SLIDE 23

2005 results and financing

slide-24
SLIDE 24

2005 results

Analytical income statement - IFRS

+26% 6,844 8,626 Operating income after distribution

+25% 1.12 1.40 Net earnings per share +29% 3,177 4,083 Net attributable income 387 442 Minority interests

+30% 2,790 3,641 Net income of the consolidated group (337) (2,318) Corporation tax +91% 3,127 5,958 Pre-tax underlying earnings (3,717) (2,668) Financial result (36,862) (46,681) Lease revenues due to investors +27% 43,706 55,307 Operating income before distribution (5,795) (7,523) Depreciation & amortization and transfers to provisions +27% 49,501 62,830 EBITDA before distribution to investors (13,375) (14,621) Overheads, selling, general and administrative expenses (57,119) (59,200) Operating expenses (65,135) (88,177) Cost of sales +21% 185,130 224,828 Revenues from activities 4,547 2,836 Capital gains on disposals +23% 180,583 221,992 Total revenues

Change 31/12/2004 31/12/2005

In thousands of euros

slide-25
SLIDE 25

2005 results

Breakdown of EBITDA by activity

The EBITDA is operating income before depreciation and amortization. Operating provisions are included in EBITDA.

  • The rise in EBITDA is due to growth in the Group’s activities

16,149 (46,681) 62,830 (3,337) 5,595 5,008 10,985 44,579 31/12/2005 12,639 (36,862) 49,501 (2,995) 3,952 3,748 7,937 36,859 31/12/2004 Change

In thousands of euros

+28% +27% +27% +11% +42% +34% +38% +21% EBITDA after distribution to investors Distribution to investors EBITDA before distribution to investors Other (overheads, sundry items and eliminations) Railcars River barges Modular buildings Shipping containers

slide-26
SLIDE 26

2005 results

Performance

  • The ROFA is made up as follows:

* ROFA - return on fixed assets: EBITDA after distribution to investors as a proportion of gross tangible fixed assets

  • The ROFA of each activity (excluding overheads and sundry items) is as

follows:

  • The decline in ROFA is explained by year-end investments in the river barges and

railcars activities.

31/12/2004 31/12/2005 In thousands of euros 12.0% 134,891 16,149 12.0% Return on fixed assets (ROFA*) 104,005 Gross tangible fixed assets 12,639 EBITDA after distribution to investors 31/12/2004 31/12/2005 In thousands of euros 7.6% 8.7% Modular buildings 10.2% 11.8% River barges 33.8% 35.2% Shipping containers 14.8% 22.2% 15.3% ROFA of activities 60.8% Railcars

slide-27
SLIDE 27

2005 results

Simplified comparative balance sheets (€m)

26 32 95 94 58 55 55 51 92 56 34 122 31.12.2005 31.12.2004 31.12.2005 31.12.2004

Non-current assets Current assets Liquid assets Shareholders’ equity Non-current liabilities Current liabilities

€206m €206m €179m €179m

slide-28
SLIDE 28

2005 results

Management of the Group’s debt

  • Continued consolidation of banking relationships
  • 20% of consolidated debt is denominated in US dollars
  • 10% of consolidated debt is without recourse to the Group
  • Objective of confirming short-term debts and increasing

flexibility in order to support the planned growth in investments in the Group’s balance sheet

  • The Group did not conduct any new rate hedging transactions

in 2005, since it considered that the breakdown of its debt into 36% fixed rate and 64% variable rate is satisfactory.

100% 3.59% 35% €32.2m Short-term credit % variable rate Avge rate % Value Gross debt 100% €91.4m Total 57% 5.10% 65% €59.2m Medium and long-term credit

slide-29
SLIDE 29

2005 results

Management of the Group’s debt

  • Financial commitments in 2006
  • To meet its commitments in 2006, the Group has cash

flow resources (average of €32m over the last three years and €38m as at 31/12/05) as well as €43m of bank lines with recourse, €27m of asset financing lines without recourse and €13m of liquid assets.

€3.0m Estimated financial expenses €5.9m Theoretical repayment of short-term credit €21.0m Theoretical repayment of revolving credit €44.9m Total €15.0m Repayment of medium/long-term credit

slide-30
SLIDE 30

2005 results

Management of the Group’s debt

  • Increase in net financial debt is in proportion to that of

shareholders’ equity

  • Gearing stable for the Group’s activities

Gearing excluding debts without recourse: 1.0

  • Leverage increased (including €9m asset purchase at year-end)

Leverage excluding debts without recourse: 3.5

€40.5m €65.4m Net financial debt 1.19 1.16 Gearing (net financial debt/shareholders’ equity) 31/12/2004 31/12/2005 4.1 3.2 Leverage (net financial debt/EBITDA)

slide-31
SLIDE 31

Financing strategy

Breakdown of gross tangible assets

Over half of the assets under management are valued in US dollars

60 120 60 180 110 260 140 300 147 367 142 342 136 378 123 418 147 540 100 200 300 400 500 600 700 1997 1998 1999 2000 2001 2002 2003 2004 2005

!"# !" $% Increase in fleet under management +20.68% Increase in

  • wned fleet

+11.85%

Average annual increase in the fleet +18.23%

180 180 240 240 370 370 440 440 514 514 487 487 514 514 541 541 687 687

slide-32
SLIDE 32

Financing strategy

Management on behalf of third parties

  • 79% of managed assets belong to third-party investors
  • Of the €540m of assets held by third-party investors, 82% are in

management programs and 18% asset backed securitizations.

  • All programs are non recourse to the Group and provide no

guaranteed minimum revenue (settlement of Trust 95 has had no impact on the Group).

  • Recurring investment by existing investors (European,

American, Asian).

  • The Group concluded management programs worth almost €100

million in 2005 in the shipping containers, modular buildings and railcars activities, enabling it to finance growth without increased borrowing.

  • More than €50 million of management programs are already

planned in 2006.

slide-33
SLIDE 33

Financing strategy

Analysis of equipment by activity

Over half of the assets under management are valued in US dollars

21 374 63 69 40 16 24 80

50 100 150 200 250 300 350 400

&$ ' (

  • )#

)' " ' #

slide-34
SLIDE 34

Strategy and targets

slide-35
SLIDE 35

Strategy and targets

Growth strategy

  • Development policy
  • To increase the fleet of new leased equipment (spread

across the four activities) ⋅ Target of €100m of investments per year, ⋅ Under long-term contracts,

  • To pursue double-digit growth in the Group in
  • rder to gain market share in all four activities

and strengthen economies of scale.

slide-36
SLIDE 36

Strategy and targets

Balance between own investments and

  • utsourced investments

Breakdown of assets under management: 25% of equipment

  • wned and 75% managed on behalf of third parties
  • Investment in owned assets generates significant

recurrent income and increases the value of the Group in the long term by creating opportunities for capital gains

  • n disposals.
  • Outsourcing of investment to investors allows:
  • Generation of income from assets under management
  • Improvement in the return on equity without tying up

capital.

  • The target is a 15% return on equity in the long term

while optimizing the group’s borrowing capacity

slide-37
SLIDE 37

Strategy and objectives

Target for 2006

2006 income target: Increase of more than 30%

slide-38
SLIDE 38

Touax and the stock market

1906 - 2006: 100 years as a listed company First listing on the Marché Comptant of the Paris stock exchange on 7 May 1906

slide-39
SLIDE 39

Touax and the stock market

Share price

Member of the NextPrime segment ISIN code: FR0000033003

Share price of Touax SA (FR) in EUR on 21/03/06 (base 100) 80 100 120 140 160 180 200 220 240 260 Dec 02 Mar 03 Jun 03 Sep 03 Dec 03 Mar 04 Jun 04 Sep 04 Dec 04 Mar 05 Jun 05 Sep 05 Dec 05 Mar 06 Touax SA SBF 250 (FR)
slide-40
SLIDE 40

Touax and the stock market

Stock market data

(1) Years prior to 2004 are under French GAAP. International standards are used for 2004 and subsequent years. (2) The 2005 yield is calculated on the basis of an annual total gross distribution of €0.70/share (subject to AGM). 20.60 2.9% 0.6 18.39 1.12 1,038 14.55 21.20 34.01 58.47 2,838 2004 14.95 4.0% 0.6 16.43 0.91 764 9.80 16.75 46.04 42.43 2,838 2003 12.33 4.9% 0.6 13.85 0.89 364 11.00 19.50 51.31 34.99 2,838 2002 0.7 (2) Total net distribution per share (€) 23.45 3.0% (2) 16.75 1.40 4,385 19.25 23.72 56.39 88.29 3,765 2005 Overall yield of the share Closing price Consolidated attributable shareholders’ equity (€m) (1) Net EPS (€) Annualized P/E ratio Average daily volume (in number of shares) Lowest price (€) Highest price (€) Market capitalization (in €m) Number of shares (in thousands)

slide-41
SLIDE 41

Touax and the stock market

A yield stock

  • A policy of regular dividend distribution (108th

consecutive dividend paid):

  • 2002: €1.70m
  • 2003: €1.70m
  • 2004: €1.70m
  • 2005: €2.64m
  • Frequent distribution of free shares:
  • 1990: 1 new share for 3 old shares
  • 1992: 1 for 3
  • 1995: 1 for 2
  • 2001: 1 for 5
slide-42
SLIDE 42

Touax and the stock market

Strengths of the Touax share

  • Security:
  • Recurring cash flows associated with the

standardization and long life of the equipment enabling it to retain high market values.

  • Internationalization:
  • Allows better spread of geographic risks.
  • Diversification:
  • Allows better spread of sector risks.
  • Attractive valuation:
  • Yield stock based on tangible assets.
slide-43
SLIDE 43

2005 results

Palais Brongniart, 30 March 2006 1906 – 2006: 100 years as a listed company

slide-44
SLIDE 44
slide-45
SLIDE 45

ERROR: syntaxerror OFFENDING COMMAND: --nostringval-- STACK: /Title () /Subject (D:20061004161516) /ModDate () /Keywords (PDFCreator Version 0.8.0) /Creator (D:20061004161516) /CreationDate (AND) /Author

  • mark-