* 1 Sequence data Sequence data * 2 Align Sequences Align - - PowerPoint PPT Presentation

1 sequence data sequence data 2 align sequences align
SMART_READER_LITE
LIVE PREVIEW

* 1 Sequence data Sequence data * 2 Align Sequences Align - - PowerPoint PPT Presentation

Inferring trees is difficult!!! MODELS OF PROTEIN EVOLUTION: 1. The method problem AN INTRODUCTION TO AMINO ACID EXCHANGE MATRICES A Method 1 Method 1 Dataset 1 Dataset 1 B ? C A Robert Hirt Method 2 Method 2 Department of Zoology,


slide-1
SLIDE 1

1

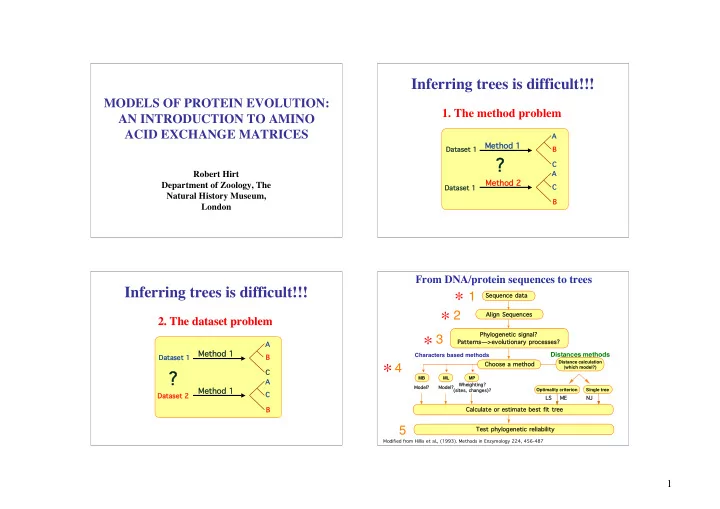
MODELS OF PROTEIN EVOLUTION: AN INTRODUCTION TO AMINO ACID EXCHANGE MATRICES

Robert Hirt Department of Zoology, The Natural History Museum, London

Inferring trees is difficult!!!

  • 1. The method problem

Dataset 1 Dataset 1 A B C B C A Dataset 1 Dataset 1

Method 1 Method 1 Method 2 Method 2

?

Dataset 1 Dataset 1 A B C B C A

  • 2. The dataset problem
  • 2. The dataset problem

Dataset 2 Dataset 2

Method 1 Method 1 Method 1 Method 1

?

Inferring trees is difficult!!!

From DNA/protein sequences to trees

Modified from Hillis et al., (1993). Methods in Enzymology 224, 456-487

1 2 3 4 5

Align Align Sequences Sequences Phylogenetic Phylogenetic signal? signal? Patterns Patterns—>evolutionary >evolutionary processes? processes? Test Test phylogenetic phylogenetic reliability reliability

Distances methods

Choose Choose a a method method

MB ML

Characters based methods

Single tree Optimality criterion

Calculate Calculate or

  • r estimate

estimate best best fit fit tree tree

LS LS ME ME NJ NJ

Distance calculation (which model?) Model? Model? MP Wheighting Wheighting? (sites, (sites, changes)? changes)? Model? Model?

Sequence Sequence data data

* * * *

slide-2
SLIDE 2

2

Agenda

  • Some general considerations

– why protein phylogenetics? – What are we comparing? Protein sequences - some basic features – Protein structure/function and its impact on patterns of mutations

  • Amino acid exchange matrices: where do they come from

and when do we use them?

– Database searches (Blast, FASTA) – Sequence alignment (ClustalX) – Phylogenetics (model based methods)

Why protein phylogenies? Why protein phylogenies?

  • For historical reasons - the first sequences

For historical reasons - the first sequences

  • Most genes encode proteins

Most genes encode proteins

  • To study protein structure, function and evolution

To study protein structure, function and evolution

  • Comparing DNA and protein based phylogenies can

Comparing DNA and protein based phylogenies can be useful be useful

– – Different genes - e.g. 18S Different genes - e.g. 18S rRNA rRNA versus EF-2 protein versus EF-2 protein – – Protein encoding gene - Protein encoding gene - codons codons versus amino acids versus amino acids

Proteins were the first molecular sequences to be used for phylogenetic inference

  • Fitch and Margoliash (1967).

Construction of phylogenetic trees. Science 155, 279-284.

Phylogenies from proteins

  • Parsimony
  • Distance matrices
  • Maximum likelihood
  • Bayesian methods
slide-3
SLIDE 3

3

Evolutionary models for amino acid changes

  • All methods have explicit or implicit evolutionary

models

  • Can be in the form of simple formula

– Kimura formula to estimate distances

  • Most models for amino acid changes typically include

– 20x20 rate matrix – Correction for rate heterogeneity among sites (G [a]+ G [a]+ pinv) – Assume neutrality - what if there are biases, or non neutral changes - such as selection?

Character states in DNA and protein alignments

  • DNA sequences have four states (five): A, C, G, T,

(and ± indels)

  • Proteins have 20 states (21): A, C, D, E, F, G, H, I, K,

L, M, N, P, Q, R, S, T, V, W, Y (and ± indels)

—> more information in DNA or protein alignments?

DNA->Protein: the code

  • 3 nucleotides (a codon) code for one amino acid

(61 codons! 61x61 rate matrices?)

  • Degeneracy of the code: most amino acids are

coded by several codons

—> more data/information in DNA?

DNA—>Protein

  • The code is degenerate:

20 amino acids are encoded by 61 possible codons (3 stop codons)

  • Complex patterns of changes among codons:

– Synonymous/non synonymous changes – Synonymous changes correspond to codon changes not affecting the coded amino acid

slide-4
SLIDE 4

4

Codon degeneracy: protein alignments as a guide for DNA alignments

GAA-GGA-AGC-TCC-TGG-TTA-CTC-CTG-GGA-TCC GAG-GGT-TCC-AGC-TAT-CTA-TTA-ATT-GGT-AGC GAC-GGC-AGT-GCA-TGG-TTG-CTT-TTG-GGC-AGT GAT-GGG-TCA-GCT-TAC-CTC-CTG-GCC-GGG-TCA Glu Glu-

  • Gly

Gly-

  • Ser

Ser-

  • Ser

Ser-

  • Trp

Trp-

  • Leu

Leu-

  • Leu

Leu-

  • Leu

Leu-

  • Gly

Gly-

  • Ser

Ser Glu Glu-

  • Gly

Gly-

  • Ser

Ser-

  • Ser

Ser-

  • Tyr

Tyr-

  • Leu

Leu-

  • Leu

Leu-

  • Ile

Ile-

  • Gly

Gly-

  • Ser

Ser Asp Asp-

  • Gly

Gly-

  • Ser

Ser-

  • Ala

Ala-

  • Trp

Trp-

  • Leu

Leu-

  • Leu

Leu-

  • Leu

Leu-

  • Gly

Gly-

  • Ser

Ser Asp Asp-

  • Gly

Gly-

  • Ser

Ser-

  • Ala

Ala-

  • Tyr

Tyr-

  • Leu

Leu-

  • Leu

Leu-

  • Ala

Ala-

  • Gly

Gly-

  • Ser

Ser Ask James for PUTGAPS…

DNA->Protein: code usage

  • Difference in codon usage can lead to large base

composition bias - in which case one often needs to remove the 3rd codon, the more bias prone site… and possibly the 1st

  • Comparing protein sequences can reduce the

compositional bias problem

—> more information in DNA or protein?

Models for DNA and Protein evolution

  • DNA: 4 x 4 rate matrices

– Easy to estimate (can be combined with tree search)

  • Protein: 20 x 20 matrices

– More complex: time and estimation problems (rare changes?) -> empirical models from large datasets are typically used

Evolutionary models for amino acid changes

  • All methods have explicit or implicit evolutionary

models

  • Can be in the form of simple formula

– Kimura formula to estimate distances

  • Most models for amino acid changes typically include

– 20x20 rate matrix – Correction for rate heterogeneity between sites (G [a]+ G [a]+ pinv)

slide-5
SLIDE 5

5

Proteins and amino acids

  • Proteins determine shape and structure of cells and

carry most catalytic processes - 3D

  • Proteins are polymers of 20 different amino acids
  • Amino acids sequences determine the structure

(2ndary, 3ary…) and function of the protein

  • Amino acids can be categorized by their side chain

physicochemical properties

– Polarity (hydrophobic versus hydrophilic, +/- charges) – Size (small versus large)

Amino acid physico-chemical properties

– Major factor in protein folding – Key to protein functions — —> Major influence in pattern > Major influence in pattern

  • f amino acid mutations
  • f amino acid mutations

As for Ts versus Tv in DNA sequences, some amino acid changes are more common than

  • thers: very important for sequence

comparisons (alignment and phylogenetics!)

Small <—> small > small <—> big

Estimation of relative rates of residue replacement (models of evolution)

  • Differences/changes in protein alignments can be pooled and

patterns of changes investigate.

– Selected sequence, alignment and counting method dependent! Empirical models!

  • Patterns of changes give insights into the evolutionary processes

underlying protein diversification -> estimation of evolutionary models

– How general is such a model?

  • Choice of protein evolutionary models can be important for the

sequence analysis we perform (database searching, sequence alignment,

phylogenetics)

Amino acid substitution matrices based on observed substitutions: “empirical models”

  • Summarise the substitution pattern from large

amount of existing data

  • Based on a selection of proteins

– Globular proteins, membrane proteins? – Mitochondrial proteins?

  • Uses a given counting method and the counted

changes to be recorded

– tree dependent/independent – restriction on the sequence divergence

slide-6
SLIDE 6

6

Amino acid physico-chemical properties

– Size – Polarity – Hydrophilic (polar, +/- charges) – Hydrophobic (non polar)

P A G CS-H CS-S S N Q Y W F M I V L T

Small Hydrophobic Polar

Aliphatic Tiny Aromatic Charged

Taylor’s Venn diagram of amino acids properties

K R H

  • D +

E

Amino acids categories 1: Doolittle (1985). Sci. Am. 253, 74-85. –Small polar: S, G, D, N –Small non-polar: T, A, P, C –Large polar: E, Q, K, R –Large non-polar: V, I, L, M, F –Intermediate polarity: W, Y, H

Amino acids categories 2

–Sulfhydryl: C –Small hydrophilic: S, T, A, P, G –Acid, amide: D, E, N, Q –Basic: H, R, K –Small hydrophobic : M, I, L, V –Aromatic: F, Y, W

slide-7
SLIDE 7

7

— —> Colour coding of different categories is useful for protein > Colour coding of different categories is useful for protein alignment visual inspection alignment visual inspection

Phylogenetic trees from protein alignments

  • Parsimony based methods - unweighted/weighted
  • Distance methods - model for distance estimation

– probability of amino acid changes, site rate heterogeneity

  • Maximum likelihood and Bayesian methods- model for ML

calculations – probability of amino acid changes, site rate heterogeneity

Trees from protein alignment: Parsimony methods - cost matrices

  • All changes weighted equally
  • Differential weighting of changes: an attempt to

correct for homoplasy!:

– Based on the minimal number of amino acid substitutions, the genetic code matrix (PHYLIP -PROTPARS) – Weights based on physico-chemical properties of amino acids – Weights based on observed frequency of amino acid substitutions in alignments

Parsimony: unweighted matrix for amino acid changes –Ile -> Leu cost = 1 –Trp -> Asp cost = 1 –Ser -> Arg cost = 1 –Lys -> Asp cost = 1

slide-8
SLIDE 8

8

Parsimony: weighted matrix for amino acid changes, the genetic code matrix –Ile -> Leu cost = 1 –Trp -> Asn cost = 3 –Ser -> Arg cost = 2 –Lys -> Asp cost = 2

Weighting matrix based on minimal amino acid changes PROTPARS in PHYLIP

A C D E F G H I K L M N P Q R 1 2 T V W Y [A] 0 2 1 1 2 1 2 2 2 2 2 2 1 2 2 1 2 1 1 2 2 [C] 2 0 2 2 1 1 2 2 2 2 2 2 2 2 1 1 1 2 2 1 1 [D] 1 2 0 1 2 1 1 2 2 2 2 1 2 2 2 2 2 2 1 2 1 [E] 1 2 1 0 2 1 2 2 1 2 2 2 2 1 2 2 2 2 1 2 2 [F] 2 1 2 2 0 2 2 1 2 1 2 2 2 2 2 1 2 2 1 2 1 [G] 1 1 1 1 2 0 2 2 2 2 2 2 2 2 1 2 1 2 1 1 2 [H] 2 2 1 2 2 2 0 2 2 1 2 1 1 1 1 2 2 2 2 2 1 [I] 2 2 2 2 1 2 2 0 1 1 1 1 2 2 1 2 1 1 1 2 2 [K] 2 2 2 1 2 2 2 1 0 2 1 1 2 1 1 2 2 1 2 2 2 [L] 2 2 2 2 1 2 1 1 2 0 1 2 1 1 1 1 2 2 1 1 2 [M] 2 2 2 2 2 2 2 1 1 1 0 2 2 2 1 2 2 1 1 2 3 [N] 2 2 1 2 2 2 1 1 1 2 2 0 2 2 2 2 1 1 2 3 1 [P] 1 2 2 2 2 2 1 2 2 1 2 2 0 1 1 1 2 1 2 2 2 [Q] 2 2 2 1 2 2 1 2 1 1 2 2 1 0 1 2 2 2 2 2 2 [R] 2 1 2 2 2 1 1 1 1 1 1 2 1 1 0 2 1 1 2 1 2 [1] 1 1 2 2 1 2 2 2 2 1 2 2 1 2 2 0 2 1 2 1 1 [2] 2 1 2 2 2 1 2 1 2 2 2 1 2 2 1 2 0 1 2 2 2 [T] 1 2 2 2 2 2 2 1 1 2 1 1 1 2 1 1 1 0 2 2 2 [V] 1 2 1 1 1 1 2 1 2 1 1 2 2 2 2 2 2 2 0 2 2 [W] 2 1 2 2 2 1 2 2 2 1 2 3 2 2 1 1 2 2 2 0 2 [Y] 2 1 1 2 1 2 1 2 2 2 3 1 2 2 2 1 2 2 2 2 0

W: TGG ||| N: AAC AAT A minimum of 3 changes are needed at the DNA level for W<->N

Phylogenetic trees from protein alignments

  • Parsimony based methods - unweighted/weighted
  • Distance methods - model for distance estimation

– probability of amino acid changes, site rate heterogeneity

  • Maximum likelihood and Bayesian methods- model for ML

calculations – probability of amino acid changes, site rate heterogeneity

A two step approach - two choices!

1) Estimate all pairwise distances

Choose a method (100s) - has an explicit model for sequence evolution

2) Estimate a tree from the distance matrix

Choose a method: with or without an optimality criterion?

Distance methods

slide-9
SLIDE 9

9

Estimation of protein pairwise distances

  • 1. Simple formula
  • 2. More complex models
  • 20 x 20 matrices (evolutionary model):

– Identity matrix – Genetic code matrix – Mutational data matrices (MDMs)

  • Correction for rate heterogeneity between sites

(G [a]+ G [a]+ pinv)

The Kimura formula: correction for multiple hits

dij = -Ln (1 - Dij - (Dij2/5))

  • Dij the observed dissimilarity between i and j (0-1).
  • Can give good estimate of dij for 0.75 > Dij > 0
  • It can approximates the PAM matrix well
  • If Dij ≥ 0.8541, dij = infinite.
  • Does not take into account which amino acid are changing
  • Implemented in Clustal and PHYLIP
  • > Importance of mutational matrices, MDM!

Amino acid substitution matrices (MDMs)

  • Sequence alignments based matrices

PAM, JTT, BLOSUM, WAG...

  • Structure alignments based matrices

STR (for highly divergent sequences)

Protein alignment may be guided by structural Protein alignment may be guided by structural interactions interactions

  • Escherichia. coli
  • Escherichia. coli

djlA djlA protein protein Homo sapiens Homo sapiens djlA djlA protein protein

slide-10
SLIDE 10

10

Protein distance measurements with MDM

20 x 20 matrices:

  • PAM, BLOSUM, WAG…matrices
  • Maximum likelihood calculation which

takes into account:

– All sites in the alignment – All pairwise rates in the matrix – Branch length

dij = ML [P(n), Xij, (G, G, pinv)]

(dodgy notation!)

dij = -Ln (1 - Dij - (Dij

2/5))= F(Dij)

How is an MDM inferred?

Observed raw changes are corrected for: Observed raw changes are corrected for:

  • The amino acid relative mutability

The amino acid relative mutability

  • The amino acid normalised frequency

The amino acid normalised frequency Differences between MDM comes from: Differences between MDM comes from:

  • Choice of proteins used

Choice of proteins used (membrane, globular)

(membrane, globular)

  • Range of sequence similarities used

Range of sequence similarities used

  • Counting methods

Counting methods

  • On a tree [MP, ML]

On a tree [MP, ML]

  • Pairwise

Pairwise comparison from an alignment comparison from an alignment

  • > empirical models from large datasets are typically used

How is an MDM inferred?

seq.1 AIDESLIIASIATATI |*||*||*||*||*|| seq.2 AGDEALILASAATSTI The raw data: observed changes in pairwise comparisons in an alignment or on a tree

A S T G I L E D A 3 S 2 1 T 0 0 1 G 0 0 0 0 I 1 0 0 1 2 L 0 0 0 0 1 1 E 0 0 0 0 0 0 1 D 0 0 0 0 0 0 1 0

seq.1 AIDESLIIASIATATI |*||*||*||*||*|| seq.2 AGEEALILASAATSTI

Raw matrix Symmetrical!

  • > The larger the dataset the better the estimates!
slide-11
SLIDE 11

11

Amino Acid exchange matrices

  • s1,2 s1,3 … s1,20

s1,2 - s2,3 … s2,20 s1,3 s2,3 - … s3,20 … … … … … s1,20 s2,20 s3,20 … -

X diag(̟1, …, ̟20) = Q matrix Q Rate matrix Qij Instantaneous rates of change of amino acids sij Exchangeabilities of amino acid pairs ij sij = sij Time reversibility ̟i Stationarity of amino acid frequencies (typically the observed proportion of residues in the dataset)

Amino Acid exchange matrices

R Q P R F

Raw matrix Observed changes (counted on a MP tree

  • r in pairwise comparisons)

Relatedness odd matrix

Used for scoring alignments (Blast, Clustal)

Rate matrix

(with composition, not branch length)

Relative rate matrix

(no composition, no branch length)

Probability matrix

(composition + branch length) Can be estimated using ML on a tree Modified from Peter Foster

The PAM and JTT matrices

  • PAM - Dayhoff et al. 1968

– Nuclear encoded genes, ~100 proteins

  • JTT - Jones et al. 1992

– 59,190 accepted point mutations for 16,300 proteins

Jones, Taylor & Thornton (1992). CABIOS 8, 275-282

The BLOSUM matrices

  • BLOcks SUbstitution Matrices

– The matrix values are based on 2000 conserved amino acid patterns (blocks) - pairwise comparisons —> more efficient for distantly related proteins —> more agreement with 3D structure data BLOSUM62 - 62% minimum sequence identity BLOSUM50 - 50% minimum sequence identity

Henikoff & Henikoff (1992). Proc Natl Acad Sci USA 89, 10915-9

slide-12
SLIDE 12

12

The WAG matrix

  • Globular protein sequences

– 3,905 sequences from 182 protein families

  • Produced a phylogenetic trees for every family and

used maximum likelihood to estimate the relative rate values in the rate matrix (overall lnL over 182 different trees)

– Better fit of the model with most data (significant improvement of

the lnL of a tree when compared to PAM or JTT matrices)

– Might not be the best option in some cases…

Whelan and Goldman (2001) Mol. Biol. Evol. 18, 691-699

Comparisons of MDMs:

(sij) amino acid exchangeability

Whelan and Goldman (2001) Mol. Biol. Evol. 18, 691-699

Log-odds matrices

MDMij = 10 log10 Rij

The MDMij values are rounded to the nearest integer

MDM MDMij

ij

< 0 freq. less than chance < 0 freq. less than chance MDM MDMij

ij

= 0 freq. expected by chance = 0 freq. expected by chance MDM MDMij

ij

> 0 freq. greater then chance > 0 freq. greater then chance

The Log-odds matrices can be used The Log-odds matrices can be used for scoring alignments (Blast and for scoring alignments (Blast and Clustal Clustal) )

BLOSUM62 Amino Acid Substitution Matrix

C S T P A G N D E Q H R K M I L V F Y W C 9 C sulfhydryl S -1 4 S T -1 1 5 T P -3 -1 -1 7 P small A 0 1 0 -1 4 A hydrophilic G -3 0 -2 -2 0 6 G N -3 1 0 -2 -2 0 6 N D -3 0 -1 -1 -2 -1 1 6 D acid, acid-amide E -4 0 -1 -1 -1 -2 0 2 5 E and hydrophilic Q -3 0 -1 -1 -1 -2 0 0 2 5 Q H -3 -1 -2 -2 -2 -2 1 -1 0 0 8 H R -3 -1 -1 -2 -1 -2 0 -2 0 1 0 5 R basic K -3 0 -1 -1 -1 -2 0 -1 1 1 -1 2 5 K M -1 -1 -1 -2 -1 -3 -2 -3 -2 0 -2 -1 -1 5 M I -1 -2 -1 -3 -1 -4 -3 -3 -3 -3 -3 -3 -3 1 4 I small L -1 -2 -1 -3 -1 -4 -3 -4 -3 -2 -3 -2 -2 2 2 4 L hydrophobic V -1 -2 0 -2 0 -3 -3 -3 -2 -2 -3 -3 -2 1 3 1 4 V F -2 -2 -2 -4 -2 -3 -3 -3 -3 -3 -1 -3 -3 0 0 0 -1 6 F Y -2 -2 -2 -3 -2 -3 -2 -3 -2 -1 2 -2 -2 -1 -1 -1 -1 3 7 Y aromatic W -2 -3 -2 -4 -3 -2 -4 -4 -3 -2 -2 -3 -3 -1 -3 -2 -3 1 2 11 W C S T P A G N D E Q H R K M I L V F Y W MDM MDMij

ij < 0 freq. less than chance

< 0 freq. less than chance MDM MDMij

ij = 0 freq. expected by chance

= 0 freq. expected by chance MDM MDMij

ij > 0 freq. greater then chance

> 0 freq. greater then chance

slide-13
SLIDE 13

13

Summary

  • Many amino acid rate matrices exist and one needs to

choose one for protein comparisons (alignment, phylogenetics...) do not hesitate to experiment!

  • One should make a rational choice (as much as

possible):

– How was the rate matrix produced? – What are the structural features of the sequences you are comparing? Globular/membrane protein? – What is the level of sequence identity of the compared sequences?

  • Always try to correct for rate heterogeneity between

sites in phylogenetics!

Summary 2

  • In practice MDM are obtained by averaging the
  • bserved changes and amino acid frequencies between

numerous proteins (e.g. JTT, BLOSUM) and are used for your specific dataset

– You can correct an MDM for the ̟i values of your data (amino acid frequencies)

  • Specific matrices have been calculated to reflect

particular composition biases (e.g. the mitochondrial proteins matrix: mtREV24)

  • Future work: What about context-dependent MDM:

alpha helices versus beta sheets, surface accessibility? (Heterogenous models)

From DNA/protein sequences to trees

Modified from Hillis et al., (1993). Methods in Enzymology 224, 456-487

1 2 3 4 5

Align Align Sequences Sequences Phylogenetic Phylogenetic signal? signal? Patterns Patterns—>evolutionary >evolutionary processes? processes? Test Test phylogenetic phylogenetic reliability reliability

Distances methods

Choose Choose a a method method

MB ML

Characters based methods

Single tree Optimality criterion

Calculate Calculate or

  • r estimate

estimate best best fit fit tree tree

LS LS ME ME NJ NJ

Distance calculation (which model?) Model? Model? MP Wheighting Wheighting? (sites, (sites, changes)? changes)? Model? Model?

Sequence Sequence data data

* * * *