1 US COMMERCIAL PROPERTY SALES US COMMERCIAL PROPERTY SALES - - PDF document

1
SMART_READER_LITE
LIVE PREVIEW

1 US COMMERCIAL PROPERTY SALES US COMMERCIAL PROPERTY SALES - - PDF document

OVERVIEW Commercial Real Estate Investment Market Update Housing versus Commercial Real Estate Presented To: Changes in the Capital Markets Commercial Real Estate as an Investment Class Trends by Property Type Office


slide-1
SLIDE 1

1

Commercial Real Estate Investment Market Update

Presented To: Presented By:

  • J. Scott Adams, CCIM

Mid-South Regional President March 12, 2008

OVERVIEW

Housing versus Commercial Real Estate Changes in the Capital Markets Commercial Real Estate as an Investment Class Trends by Property Type

  • Office
  • Industrial
  • Multi-Family
  • Retail

HOUSING VS COMMERCIAL REAL ESTATE

3 Key Reasons this is a Housing Recession and not a Commercial Real Estate Recession 1.Residential construction doubled over 5 year period from 2001 to 2006 2.Over-reliance of residential boom on speculative investors 3.Residential lending practices allowed “no money down”

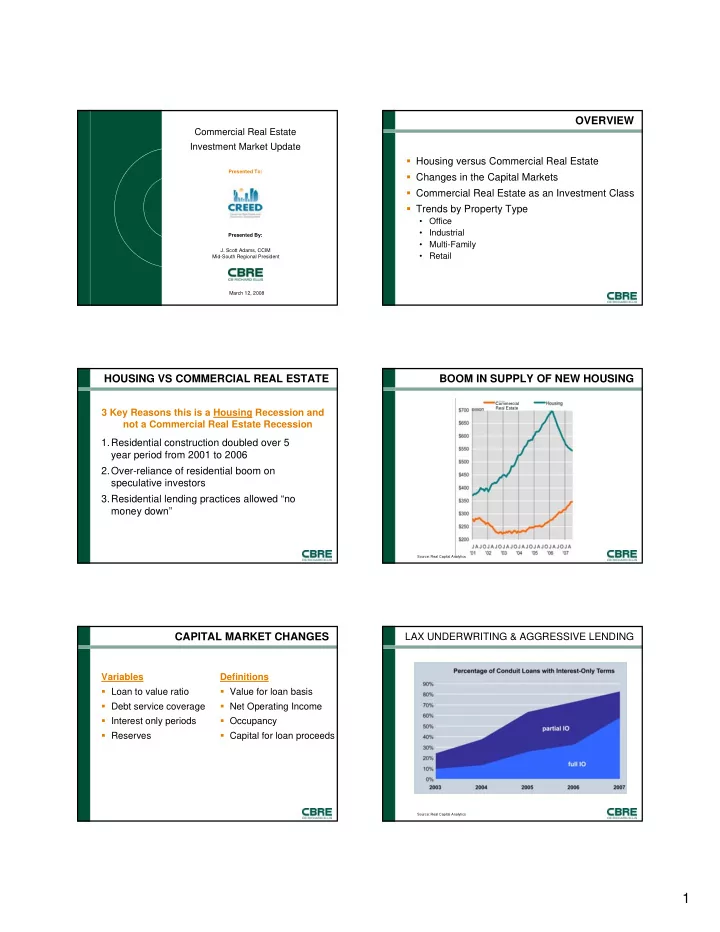
BOOM IN SUPPLY OF NEW HOUSING

Commercial Real Estate Source: Real Capital Analytics

CAPITAL MARKET CHANGES

Variables Loan to value ratio Debt service coverage Interest only periods Reserves Definitions Value for loan basis Net Operating Income Occupancy Capital for loan proceeds

LAX UNDERWRITING & AGGRESSIVE LENDING

Source: Real Capital Analytics
slide-2
SLIDE 2

2

US COMMERCIAL PROPERTY SALES Commercial Real Estate is now a “Major Food Group”

Alternative investment opportunities not rock solid either Underlying fundamentals remain healthy Commercial real estate with predictable and transparent contractual cash flows Key perspective is returns on a “risk adjusted basis”

US COMMERCIAL PROPERTY SALES

Source: Real Capital Analytics; minimum value of $5 million

Office, Industrial, Multifamily & Retail Properties

ANALYSIS OF INVESTMENT RETURNS How Investment Returns have been so Great

Moderate growth in net operating income

  • Growth in rents
  • Rising occupancy

Sharp decline in capitalization rates

EVOLUTION OF INVESTMENT RETURNS

Office, Industrial, Retail, Multi-Housing: NCREIF Weighted Source: TWR Investment Database

Last 5 Years vs. Next 5 Years

Big Difference!

0.0% 1.0% 2.0% 3.0% 4.0% 5.0% 6.0% 7.0% 8.0% 9.0% 10.0% $0 $50 $100 $150 $200 $250 2003 2004 2005 2006 2007 Average Cap Rate Total Price (in billion)

NATIONAL OFFICE SALES

Source: Real Capital Analytics

Higher volume and lower cap rates

The Good News: Economic expansion has been increasingly driven by office-occupying industries The Bad News: Softening economy will lead to slower growth in rents and less space absorption

2007 HAMPTON ROADS OFFICE SALES

LANDMARK TRANSACTIONS

Gee’s Group Portfolio 150 W. Main

150 W. Main Lynnhaven Corporate Center I Silver Oak Southport Centre Twin Oaks I & II

slide-3
SLIDE 3

3

0.0% 1.0% 2.0% 3.0% 4.0% 5.0% 6.0% 7.0% 8.0% 9.0% 10.0% $0 $5 $10 $15 $20 $25 $30 $35 $40 2003 2004 2005 2006 2007 Average Cap Rate Total Price (in billion)

NATIONAL INDUSTRIAL SALES

Higher volume and lower cap rates

Source: Real Capital Analytics

The Good News: Export business and business to business services are expected to continue to grow The Bad News: Impacted by the slowing economy especially with goods related to housing and retailers

2007 HAMPTON ROADS INDUSTRIAL SALES

LANDMARK TRANSACTIONS

Commonwealth Storage

0.0% 1.0% 2.0% 3.0% 4.0% 5.0% 6.0% 7.0% 8.0% $0 $20 $40 $60 $80 $100 $120 2003 2004 2005 2006 2007 Average Cap Rate Total Price (in billion)

NATIONAL MULTI-FAMILY SALES

Slow down in volume growth and cap rate decline

Source: Real Capital Analytics

The Good News: More people will decide to rent rather than pursue home ownership The Bad News: Shadow competition of rental supply created by unsold homes and condos listed for rent HAMPTON ROADS MULTI-FAMILY TRANSACTIONS

LANDMARK TRANSACTIONS

The Heights and The Myrtles at Olde Towne Portfolio

The Myrtles The Heights

0.0% 1.0% 2.0% 3.0% 4.0% 5.0% 6.0% 7.0% 8.0% 9.0% $0 $10 $20 $30 $40 $50 $60 $70 $80 2003 2004 2005 2006 2007 Average Cap Rate Total Price (in billion)

NATIONAL RETAIL SALES

Higher volume and lower cap rates

Source: Real Capital Analytics

The Good News: Continued growth in lifestyle & town centers; new concepts continue to emerge The Bad News: Future performance impacted by slowdown in employment & consumer demand

HAMPTON ROADS RETAIL TRANSACTIONS

LANDMARK TRANSACTIONS

Denbigh Village Lynnhaven North

Denbigh Village Lynnhaven North

slide-4
SLIDE 4

4

FINAL THOUGHTS

“The retailers that have the right merchandise at the right price are still doing significant business. There are winners and losers in market share, and consumers are voting every day with their purchases.”

  • Daniel Hurwitz, President & CEO of Developers Diversified Realty Corp.

This concept applies to all of us in the commercial real estate profession and not just for retailer sales.