
SLIDE 1
1
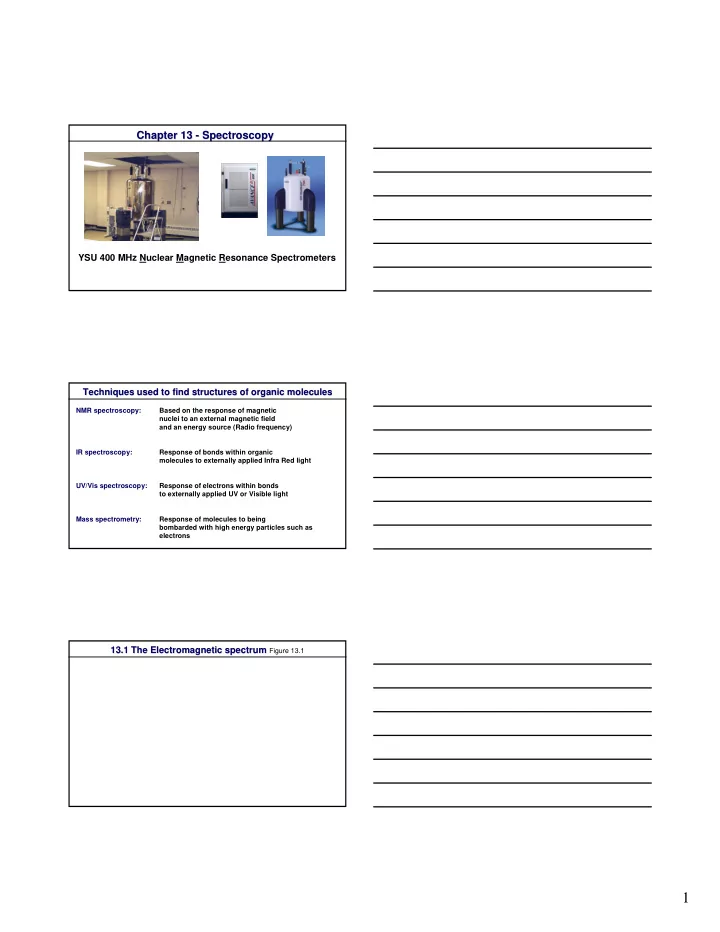
Chapter 13 Chapter 13 -
- Spectroscopy
1 13.2 Two (quantized) energy states Figure 13.2 13.2 Two - - PDF document
Chapter 13 Chapter 13 - - Spectroscopy Spectroscopy YSU 400 MHz Nuclear Magnetic Resonance Spectrometers Techniques used to find structures of organic molecules Techniques used to find structures of organic molecules NMR spectroscopy: Based
1H NMR
1H Chemical Shift
1 2 PPM
1 2 PPM
1 2 3 PPM
1H Chemical Shift
1 2 PPM
1 2 3 4 5 PPM
H H H H
1 2 3 4 5 6 7 PPM H H H H H H
1 2 3 4 5 6 7 PPM H3C CH3 CH3 O CH3 N H3C CH3
1H Chemical Shift
1 2 PPM
1H NMR Spectra
1 2 3 PPM
1H NMR Spectra
1H NMR Spectra
1 2 3 4 5 PPM
2 4 6 8 10 PPM
1H NMR Spectra
H O
2 4 6 8 10 PPM
1H NMR Spectra
OH O
2 4 6 8 10 PPM
OH O
1 2 3 PPM
1 2 3 4 5 6 7 PPM
OCH2CH3 O CH3
1 2 3 4 5 6 7 PPM
O H H H H H H H H H H H H H H
1 2 3 PPM
CH3CH2 CH3CH2 CH3CH2CH2 CH3CH2Cl
O H AcO AcO AcO N3 OAc H H H H H H
1H NMR Spectra of Alcohols
N-H N-H O N H H H H
O H
YSU YSU
YSU YSU
H-5 H-4 H-3 H-2 N-H H1, H2, H3, and H4 hard to distinguish just from coupling constants (all t, J~9 Hz)
David Temelkoff David Temelkoff O N H1 H5 H3 H4 H2 O H
13C NMR Spectroscopy
13C NMR Spectroscopy
13C NMR (ppm) 21, 52, 121, 122, 120, 126, 132, 134, 148, 168, 169 20 40 60 80 100 120 140 160 180 PPM O O O C H 3 O
13C NMR Chemical Shifts (see Sheet)
13C NMR (ppm) 23, 28, 32, 128, 151, 197 20 40 60 80 100 120 140 160 180 200 PPM
H3C O CH3 CH3 H H
13C NMR Chemical Shifts (see Sheet)
20 40 60 80 100 120 140 160 180 200 PPM 1 2 3 4 5 6 PPM
H3C O CH3 CH3 H H
13C NMR Chemical Shifts (see Sheet)
20 40 60 80 100 120 140 160 180 200 PPM
13C NMR
20 40 60 80 100 120 140 160 180 200 PPM
C CH3 CH3 CH3
Cl