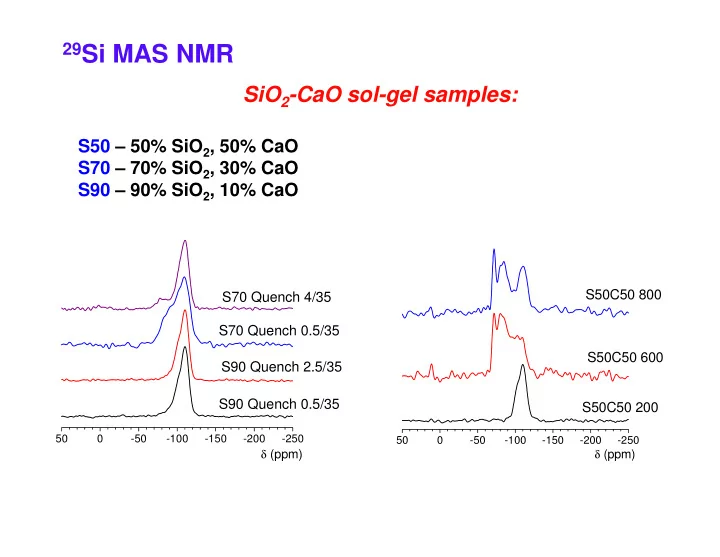
29 Si MAS NMR SiO 2 -CaO sol-gel samples: S50 50% SiO 2 , 50% CaO - - PowerPoint PPT Presentation

29 si mas nmr
SMART_READER_LITE
LIVE PREVIEW

29 Si MAS NMR SiO 2 -CaO sol-gel samples: S50 50% SiO 2 , 50% CaO - - PowerPoint PPT Presentation

29 Si MAS NMR SiO 2 -CaO sol-gel samples: S50 50% SiO 2 , 50% CaO S70 70% SiO 2 , 30% CaO S90 90% SiO 2 , 10% CaO S50C50 800 S70 Quench 4/35 S70 Quench 0.5/35 S50C50 600 S90 Quench 2.5/35 S90 Quench 0.5/35 S50C50 200 50 0 -50


slide-1
SLIDE 1

29Si MAS NMR

S50 – 50% SiO2, 50% CaO S70 – 70% SiO2, 30% CaO S90 – 90% SiO2, 10% CaO

SiO2-CaO sol-gel samples:

50

  • 50
  • 100
  • 150
  • 200
  • 250

S70 Quench 4/35 S70 Quench 0.5/35 S90 Quench 2.5/35 S90 Quench 0.5/35

δ (ppm)

50

  • 50
  • 100
  • 150
  • 200
  • 250

S50C50 800 S50C50 600 S50C50 200

δ (ppm)

slide-2
SLIDE 2

29Si MAS NMR

C40 C30

S70 N G30 S70 H8 G30

Hybrids containing collagen (C) and gelatin (G)

50

  • 50
  • 100
  • 150
  • 200
  • 250

C12

δ (ppm)

G12 S100

50

  • 50
  • 100
  • 150
  • 200
  • 250

S70 N G30 S100 H8 G30 S100 N G20

δ (ppm)

slide-3
SLIDE 3

29Si MAS NMR

Sample Peak 5 (Q0) Peak 4 (Q1) Peak 3 (Q2) Peak 2 (Q3) Peak 1 (Q4)

  • ppm

FWHM ppm I %

  • ppm

FWHM ppm I %

  • ppm

FWHM ppm I %

  • ppm

FWHM ppm I %

  • ppm

FWHM ppm I % S90 Quench 0.5/35

  • 81.1

6.02 2

  • 92.0

11.26 9

  • 100.6

9.16 21

  • 110.3

11.26 68 S90 Quench 2.5/35

  • 90.9

10.59 7

  • 100.8

9.76 27

  • 110.5

10.59 65 S70 Quench 0.5/35

  • 72.6

6.27 2

  • 81.0

9.02 10

  • 91.0

11.76 23

  • 100.4

9.41 16

  • 110.2

13.33 49 S70 Quench 4/35

  • 77.1

6.43 5

  • 83.9

8.03 5

  • 91.8

8.93 5

  • 101.7

10.71 26

  • 110.8

11.25 59 S50C50Et 200

  • 92.9

7.31 3

  • 101.2

7.65 21

  • 110.2

11.13 76 S50C50Et 600

  • 71.5

5.94 17

  • 78.7

7.58 17

  • 86.0

10.05 26

  • 102.6
  • 96.0

6.44 8.91 8 15

  • 109.6

9.48 17 S50C50Et 800

  • 71.9

5.59 19

  • 84.7

6.52 16

  • 90.8

7.45 11

  • 97.8

5.78 4

  • 110.1

14.72 37

Errors associated with measurements are—FWHM 50Hz, 1.5 ppm and Integral 2%.

S50C50Et 800

  • 71.9

5.59 19

  • 84.7
  • 79.2

6.52 5.59 16 12

  • 90.8

7.45 11

  • 97.8

5.78 4

  • 110.1

14.72 37 Organic-inorganic hybrids S100

  • 92.9

6.69 8

  • 101.3

7.86 40

  • 110.5

8.70 52 G12

  • 90.7

5.82 3

  • 101.9

9.22 41

  • 111.1

8.73 56 C12

  • 91.4

5.82 6

  • 100.9

8.81 41

  • 109.9

8.96 53 C30

  • 91.5

8.98 10

  • 100.7

7.83 34

  • 109.7

9.55 56 C40

  • 92.2

8.74 9

  • 100.7

7.46 30

  • 109.6

9.53 61 S100 N G20

  • 90.9

8.08 8

  • 101.0

8.85 39

  • 109.8

8.85 53 S100 H8 G30

  • 91.1

7.52 6

  • 101.0

9.20 40

  • 110.3

9.32 54 S70C30 N G30

  • 84.9

6.46 3

  • 92.0

6.64 8

  • 100.2

8.12 37

  • 109.2

9.23 52 S70C30 H8 G30

  • 91.2

7.10 8

  • 100.5

7.73 35

  • 109.9

9.62 57

slide-4
SLIDE 4

1H MAS NMR

S70 Quench 4/35 S70 Quench 0.5/35 S90 Quench 2.5/35 S90 Quench 0.5/35

25 20 15 10 5

  • 5
  • 10 -15 -20 -25

S90 Quench 0.5/35

δ (ppm)

Sample Hydrogen content (mol/g) S90 Quench 0.5/35 4.14 ×10⁻³ S90 Quench 2.5/35 5.42 ×10⁻³ S70 Quench 0.5/35 3.19 ×10⁻³ S70 Quench 4/35 3.66 ×10⁻³

slide-5
SLIDE 5

1H MAS NMR

Organic-inorganic hybrids

25 20 15 10 5

  • 5
  • 10
  • 15
  • 20

C40 C30 C12

δ(ppm) 25 20 15 10 5

  • 5
  • 10
  • 15
  • 20

G12 C12 S100

25 20 15 10 5

  • 5
  • 10
  • 15
  • 20

δ(ppm)

120 80 40

  • 40
  • 80

* * * * * * * *

δ (ppm)

S70 H8 G30 S70 N G30 S100 H8 G30 S100 N G20 * * * * * * * *

* - denotes spinning sidebands

Sample Hydrogen content (mol/g) S100 1.21 ×10⁻² G12 1.16 ×10⁻² C12 1.08 ×10⁻² C30 1.28 ×10⁻² C40 1.20 ×10⁻² S100 N G20 1.85 ×10⁻² S100 H8 G30 1.83 ×10⁻² S70 N G30 2.12 ×10⁻² S70 H8 G30 2.24 ×10⁻²

slide-6
SLIDE 6

250 200 150 100 50

S100 C12 G12

13C CP MAS NMR

Hybrids containing collagen (C) and gelatin (G)

250 200 150 100 50

  • 50

* * * *

* denotes spinning sidebands δ (ppm)

C40 C30

250 200 150 100 50

δ (ppm)

250 200 150 100 50

  • 50

* denotes spinning sidebands

* * * *

S70 H8 30GEL

δ (ppm)

S100 N 20GEL

δ (ppm)

slide-7
SLIDE 7

Probing the local environment of calcium in Mg-substituted apatites

Ca(1) Ca(2)

Ca10-xMgx(PO4)6(OH)2

43Ca MAS NMR spectra at 18.8 T

0% Mg Ca(2) Ca(1) Decrease in relative intensity of Ca(2) signal

δ(ppm)

  • 300
  • 200
  • 100

100 200 300

8% Mg 12% Mg 15% Mg intensity of Ca(2) signal Mg2+ enters the Ca(2) site at low Mg contents Mg2+ occupies Ca(1) and Ca(2) sites? … but the interpretation of NMR data relies on the hypothesis that

43Ca NMR parameters of the non-substituted apatite stay valid in the case of substituted apatites…

Is this actually true?

slide-8
SLIDE 8

Probing the local environment of calcium in Mg-substituted apatites

Ca(1) Ca(2)

Ca10-xMgx(PO4)6(OH)2 Ca K-edge EXAFS

(k) 0 % Mg 15 % Mg k) 0 % Mg 15 % Mg

1 3 5 7 9

r (Å) FT of k3χ( k3χ(k)

4 6 8 10

k (Å-1) Ca…O shell: very slight decrease of Ca…O distance in Mg-HA sample (consistent with XRD) 2nd shell (main contribution = Ca…Ca correlations): Decrease in Mg-HA = proof that Mg enters the lattice

slide-9
SLIDE 9

Probing the local environment of calcium in Mg-substituted apatites

Ca(1) Ca(2)

Ca10-xMgx(PO4)6(OH)2 Ca K-edge XANES

rmalised µ(E)

  • 0% Mg
  • ----- 15% Mg

1 1.5 2 4000 4050 4100 4150

Norm

E (eV) 0.5 1

No difference between the 2 spectra : The local geometry around the calcium is hardly distorted

The local environment around calcium is only very slightly modified due to Mg incorporation in the HA lattice (EXAFS + XANES). The interpretation of 43Ca NMR data is thus accurate: Mg enters the Ca(2) site of HA at low levels of incorporation.

slide-10
SLIDE 10

Probing the local environment of calcium in inorganic species: New perspectives from computational studies

20 40 60 80 silicates aluminates phosphates borates carbonates

culated δiso (ppm) Al Si P B

BO3

  • 60
  • 40
  • 20

2.35 2.40 2.45 2.50 2.55 2.60 2.65 2.70 2.75

calcu Average d(Ca…O) (in Å)

BO4

Strong dependance of δiso to the average Ca…O distance, In particular in the case of borates

43Ca NMR studies of calcium borates worth trying?

slide-11
SLIDE 11

Solid-State NMR Group

11B δ/(ppm)

  • 10
  • 5

5

P-B-Ca-Na glasses

11B MAS NMR

P50C30N17B3

  • 60
  • 40
  • 20

P50C35N10B5

31P MAS NMR

31P δ/(ppm)

5 samples, varying [B], [C] and [N] Small changes in chemical shift Small changes in peak width Same chemical shift and line width 100% of boron incomporated into phosphate network

100% Q2 100% BO4

slide-12
SLIDE 12

Solid-State NMR Group

P-B-Ca-Na glasses

Sample P50C30N17B3 P50C30N20 P50C30N15B5 P50C35N12B3 P50C35N10B5

31P δ (ppm)

–24.8 –25.1 –25.1 –25.5 –25.8

1.50 1.50 1.50 2.33 2.33 [C]/([B]+[N]) [C] has most effect on δ P50C30N17B3 P50C35N12B3 P50C30N20 P50C30N15B5 P50C35N10B5

31P width (ppm)

12.2 12.9 13.5 13.6 14.4

1.50 2.33 1.50 1.50 2.33 [B]/([C]+[N]) 0.06 0.00 0.11 0.06 0.11 0.06 0.06 0.00 0.11 0.11 [B] has most effect on width Difference between [B] = 3 & [B] = 5

slide-13
SLIDE 13

Solid-State NMR Group

P-B-Si gels

11B MAS NMR

  • 20
  • 10

10 20 30

11B δ/(ppm)

Room temperature drying 120°C drying BO4 BO3 [BO4]/[BO3] increases More B into the P network (?)

14.1 T

slide-14
SLIDE 14

Solid-State NMR Group

P-B-Si gels

  • 20
  • 15
  • 10
  • 5

5 10

31P MAS NMR

31P δ/(ppm)

Room temperature drying 120°C drying

For฀P-Si฀gels: ~10-20฀ppm฀for O=P(OH)2(OP/OSi) ~฀0฀for฀O=P(OH)3 Assignment?

slide-15
SLIDE 15

Solid-State NMR Group

P-B-Si gels

29Si MAS NMR

  • 130
  • 120
  • 110
  • 100
  • 90
  • 80

29Si δ/(ppm)

No฀change

Si(OSi)3(OH)฀Q3฀

  • r฀Si(OSi)(OH)2(OP)

Si(OSi)4฀Q4฀

  • r฀Si(OSi)2(OP)(OH)

26% 74% 27% 73%

slide-16
SLIDE 16
  • !"

#$ % " # & $ '' ' " & !( #( )&* #$' # + % " ' * , -) & #$. + # + # #$ ! " % " #( && & $ /' ' $ '/' & $0 '

  • ) & #$.

) +, 1$ ' 2 $ ) , $( & 1$ $

slide-17
SLIDE 17

This study : This study :

Previous study :

(50mol%) (50mol%)P2O5 (30) (30)CaO

CaO (20

(20-

  • x)

x)Na

Na2

2O (x)

(x)TiO

TiO2

{x=0,5,10,15} {x=0,5,10,15}

This study : This study :

(45mol%) (45mol%)P2O5

5 (30)

(30)CaO

CaO (25

(25-x) x)Na

Na2O (x)

(x)TiO

TiO2

{x=0,1,3,5,10,15} {x=0,1,3,5,10,15} (55mol%) (55mol%)P2O5

5 (30)

(30)CaO

CaO (15

(15-x) x)Na

Na2O (x)

(x)TiO

TiO2

{x=0,1,3,5} {x=0,1,3,5}

slide-18
SLIDE 18

Bulk glass characterization Bulk glass characterization

  • Density measurements

Density measurements

  • Degradation studies

Degradation studies

  • Differential thermal analysis

Differential thermal analysis

  • Ion release measurements using IC

Ion release measurements using IC

  • Ti release using ICP mass

Ti release using ICP mass

  • X-ray powder diffraction (XRD)

ray powder diffraction (XRD)

slide-19
SLIDE 19

Looking at Glass Ceramics Looking at Glass Ceramics

investigating the crystallisation kinetics of investigating the crystallisation kinetics of conversion to glass ceramic via: conversion to glass ceramic via:

  • Differential thermal analysis

Differential thermal analysis

  • High Temperature XRD

High Temperature XRD

slide-20
SLIDE 20

SBF – weight loss

Weight loss of nanocomposite monoliths

60 70 80 90 100 t loss (%)

SBF – pH

pH changes of SBF with nanocomposite monoliths

7.3 7.4 7.5 10 20 30 40 50 60 10 20 30 40 50 60 70 80 Time (hr) Weight l HC1152 HC2150 HC2128 309 Time (hr) 6.9 7 7.1 7.2 7.3 10 20 30 40 50 60 70 80 pH HC1152 HC2150 HC2128 309

slide-21
SLIDE 21

FTIR of SBF samples

Samples reacted for 3days.

0.5 0.6 0.7 ance 0.1 0.2 0.3 0.4 400 600 800 1000 1200 1400 1600 Absorba Wavenumber (cm-1) HC1152 HC2150 HC2128 309

slide-22
SLIDE 22

ICP Results

SBF P ion concentration

20 25 30 35 tion (mg/L) HC1152 HC2150 HC2128 309 5 10 15 20 10 20 30 40 50 60 70 80 Time (hr) Concentratio

slide-23
SLIDE 23

ICP Results 3

SBF Si Ion concentration

16 18 20 g/L) 100 120 /L)

SBF Ca Ion concentration

HC1152 HC2150 HC2128 309

2 4 6 8 10 12 14 16 10 20 30 40 50 60 70 80 Time (hr) Concentration (mg 20 40 60 80 100 10 20 30 40 50 60 70 80 Time (hr) Concentration (mg/L

slide-24
SLIDE 24

To do

  • Samples for toxicity and cell culture
  • Mechanical (3-point bending and compression)
  • 29Si NMR
slide-25
SLIDE 25

Previously, NMR

  • Connectivity Reduced
  • Ca not incorporated
  • Quantified by ICP
  • Expelled Liquor after Aging

2.6 2.8 3 3.2 3.4 3.6 3.8 4 Connectivity 70S30C 100S

  • Expelled Liquor after Aging
  • [Ca] 1.1 mol/L
  • Almost 100% Ca Dissolved!
  • This can explain why…

2 2.2 2.4 2.6 Before Stabilisation After Stabilistion

[Ca] 1.1 mol/L

slide-26
SLIDE 26

Phase Separation

  • During Drying, heterogeneous deposition
  • Capillary effects, expelled liquor first
  • 25% Ca deposited outside, diffusion difficulty
  • Confirmed by SIMS
  • This can explain why…
  • This can explain why…
slide-27
SLIDE 27

Broad Pore Size Range

  • Due to Ca distribution
  • Higher [Ca], larger pores!
  • Larger pores, lower transparency!

3.0

70S30C Translucent Phase

0.0 0.5 1.0 1.5 2.0 2.5 1 10 100 1000

Nanopore Diameter nm Desorption Dv(log d) [cc/g]

70S30C Translucent Phase 70S30C White Phase 100S

slide-28
SLIDE 28

New Role of Calcium

  • Not only a “Modifier”, but also a “Fuser”

Ca(NO3)2·4H2O Ca(NO3)2·4H2O

Less More Translucent White Before Stabilisation

slide-29
SLIDE 29

Mechanism

slide-30
SLIDE 30
slide-31
SLIDE 31

HC2-127 normalised intensity (det/mon) 0.1 0.2 0.3 0.4 0.5 0.6 0.7 0.8 0.9 1 0.05 0.1 0.15 0.2 0.25 Q intensity (det/mon) HC2-127 unreacted HC2-127 8hours HC2-127 24 hours HC2-127 3days HC2-128 normalised intensity (det/mon) 0.2 0.4 0.6 0.8 1 1.2 0.05 0.1 0.15 0.2 0.25 Q intensity (det/mon) HC2-128 unreacted HC2-128 8hours HC2-128 24 hours HC2-128 3days

slide-32
SLIDE 32
slide-33
SLIDE 33

HC2-150HF normalised intensity (det/mon) 0.03 0.04 0.05 sity (det/mon) HC2-150HF unreacted HC2-150HF 8hours HC2-150HF 24 hours HC2-150HF 3days Si standard 0.01 0.02 0.5 1 1.5 2 2.5 3 3.5 4 4.5 5 Q intensit

slide-34
SLIDE 34

HC2 140E, in-situ

slide-35
SLIDE 35

HC2 140E, in-situ

slide-36
SLIDE 36

10 20 30 40 50 60 70

Intensity /a.u.

10 20 30 40 50 60 70 1000 2000 3000 4000 5000 6000

Intensity /a.u.

Conventional XRD spectra for sol-gel sodium borophosphate heat treated at 120 °

° ° °C (From bottom to top:

P40B10Na40, P40B15Na35, P40B20Na40, P40B30Na20

10 20 30 40 50 60 70

2θ /degree

10 20 30 40 50 60 70

2θ /degrees

Conventional XRD spectra for melt- quenched sodium borophosphate heat treated at 120 °

° ° °C (From bottom to top:

P40B10Na40, P40B15Na35, P40B20Na40, P40B30Na20

slide-37
SLIDE 37

Intensity /a.u.

70 80 90 100

  • 1.5
  • 1.0
  • 0.5

0.0 0.5

Mass /% Heat flow /a.u. exo

10 20 30 40 50 60 70

2θ /degree

Conventional XRD spectra for sol-gel borophosphate P40B20Na40 heat treated at 120 (bottom), 200 (middle) and 350 (top) ° ° ° °C

100 200 300 400 500 600 700 800 900 60

  • 2.0

Temperature /

  • C

TGA/DTA traces for sol-gel sodium borophosphate P40B20Na40 heat treated at 120 ° ° ° °C

slide-38
SLIDE 38

Total correlation function for sol-gel sodium borophosphate P40B20Na40 heat treated at 200 (bottom), 350 (middle) ° ° ° °C and melt-quenched P40B20Na40 (top)

P-O P-O Na-O O···O B···B P···B P···P Na···Na

1 2 3 4 5 10 15 20

Tor r /Å

P-OT P-OB Na-O O···O B···B P···B P···P Na···Na r /Å 1.51 1.55 2.27 2.50 2.67 2.76 2.90 3.12 CN 1.1 2.8 3.9 5.5 1.7 0.8 0.8 7.4 SG_200 °C

  • 0.03

0.05 0.15 0.09 0.07 0.01 0.12 0.24 r /Å 1.48 1.57 2.29 2.51 2.67 2.75 2.91 3.10 CN 1.4 2.9 5.3 4.8 1.1 0.9 1.2 4.9 SG_350 °C

  • 0.04

0.05 0.12 0.07 0.07 0.01 0.11 0.24 r /Å 1.46 1.55 2.31 2.47 2.68 2.75 2.91 3.13 CN 1.7 2.4 5.4 4.5 0.3 1.8 2.1 6.2 MQ

  • 0.02

0.04 0.13 0.08 0.06 0.01 0.13 0.27