
SLIDE 1
1 Bente%Vestergaard%
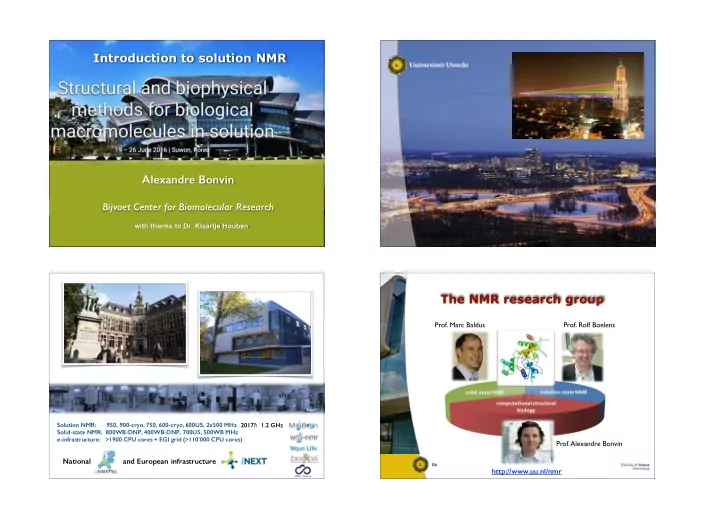
Alexandre Bonvin
Bijvoet Center for Biomolecular Research
with thanks to Dr. Klaartje Houben
Introduction to solution NMR
Solution NMR: 950(in progress) 900-cryo, 750, 600-cryo, 600US, 2x500 MHz Solid-state NMR: 800WB-DNP, 400WB-DNP, 700US, 500WB MHz e-infrastructure: >1900 CPU cores + EGI grid (>100’000 CPU cores) 2017?: 1.2 GHz
National and European infrastructure
Solution NMR: 950, 900-cryo, 750, 600-cryo, 600US, 2x500 MHz Solid-state NMR: 800WB-DNP, 400WB-DNP, 700US, 500WB MHz e-infrastructure: >1900 CPU cores + EGI grid (>110’000 CPU cores) 2017?: 1.2 GHz
National and European infrastructure
The NMR research group
- Prof. Marc Baldus
- Prof. Rolf Boelens
- Prof. Alexandre Bonvin
http://www.uu.nl/nmr