1 The Hum an Eye The Hum an Eye The eye: The center of the retina - - PDF document

1
SMART_READER_LITE
LIVE PREVIEW

1 The Hum an Eye The Hum an Eye The eye: The center of the retina - - PDF document

Basics Of Color CS 4 7 3 1 : Com put e r Gr a phics Elements of color: Lect ure 2 4 : Color Science Em m anuel Agu W hat is color? I ntroduction Color description: Red, greyish blue, white, dark green Computer Scientist:


slide-1
SLIDE 1

1

CS 4 7 3 1 : Com put e r Gr a phics Lect ure 2 4 : Color Science Em m anuel Agu
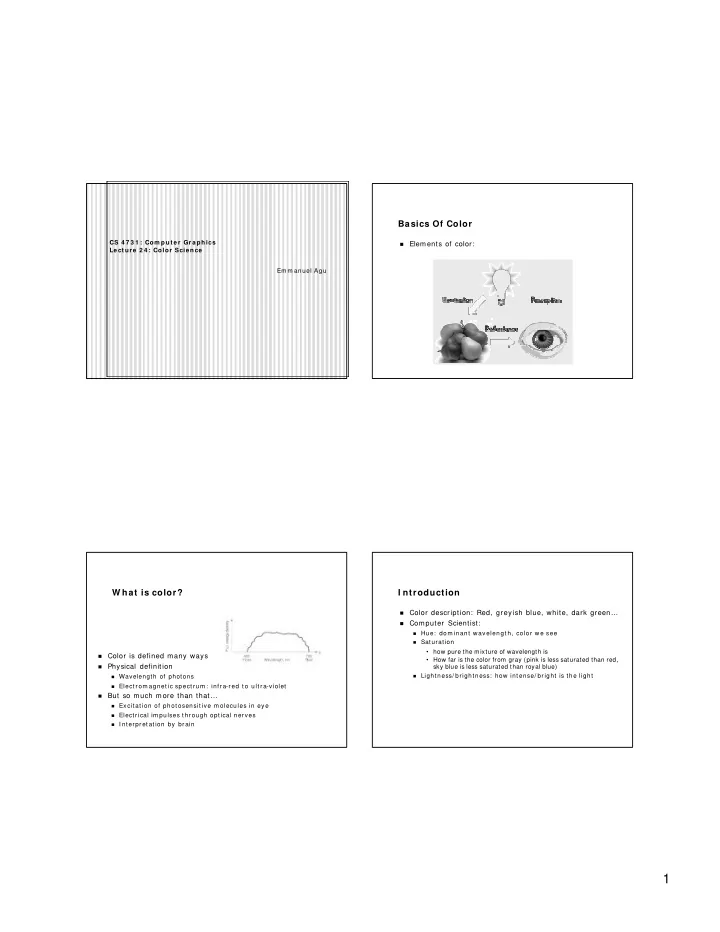
Basics Of Color

  • Elements of color:

W hat is color?

  • Color is defined m any ways
  • Physical definition
Wavelength of photons Elect rom agnet ic spect rum : infra-r ed t o ult r a-violet
  • But so much more than that…
Excit at ion of phot osensit ive m olecules in eye Elect rical im pulses t hrough opt ical nerves I nterpretation by brain

I ntroduction

  • Color description: Red, greyish blue, white, dark green…
  • Computer Scientist:
Hue: dom inant wavelengt h, color we see Saturation
  • how pure the mixture of wavelength is
  • How far is the color from gray (pink is less saturated than red,

sky blue is less saturated than royal blue)

Light ness/ bright ness: how int ense/ bright is t he light
slide-2
SLIDE 2

2

The Hum an Eye

  • The eye:
  • The retina
Rods Cones
  • Color!

The Hum an Eye

  • The center of the retina is a densely packed region called

the fovea.

Eye has about 6- 7 m illion cones Cones m uch denser here t han t he periphery

The Hum an Eye

  • Rods:
relat ively insensit ive t o color, det ail Good at seeing in dim light , general obj ect form
  • Hum an eye can distinguish
128 different hues of color 20 different saturations of a given hue
  • Visible spectrum : about 380nm to 720nm
  • Hue, lum inance, saturation useful for describing color
  • Given a color, tough to derive HSL though

Tristim ulus theory

  • 3 t ypes of cones
Loosely identify as R, G, and

B cones

  • Each is sensit ive t o it s ow n

spect rum of wavelengt hs

  • Com binat ion of cone cell

st im ulat ions give percept ion

  • f CO LO R
slide-3
SLIDE 3

3

The Hum an Eye: Cones

  • Three types of cones:
L or R, m ost sensit ive t o r ed light ( 610 nm ) M or G, m ost sensit ive t o green light ( 560 nm ) S or B, m ost sensit ive t o blue light ( 430 nm ) Color blindness result s from m issing cone t ype( s)

The Hum an Eye: Seeing Color

  • The tristim ulus curve shows
  • verlaps, and different levels of

responses

  • Eyes m ore sensitive around

550nm, can distinquish sm aller differences

  • What color do we see the best?
Yellow - gr een at 550 nm
  • What color do we see the

worst?

Blue at 440 nm

Color Spaces

  • Three t ypes of cones suggest s color is a 3D quant it y.
  • How t o define 3D color space?
  • Color m at ching idea:
shine given wavelength (λ) on a screen Mix three other wavelengths (R,G,B) on same screen. Have user adjust intensity of RGB until colors are identical:

CI E Color Space

  • CIE (Com m ission I nternationale d’Eclairage) cam e up

with three hypothetical lights X, Y, and Z with these spectra:

  • I dea: any wavelength λ can be m atched perceptually by

positive com binations of X,Y,Z

  • CI E created table of XYZ values for all visible colors

Note that: X ~ R Y ~ G Z ~ B

slide-4
SLIDE 4

4

CI E Color Space

  • The gamut of all colors perceivable is thus a three-

dim ensional shape in X,Y,Z

  • Color = X’ X + Y’Y + Z’Z

CI E Chrom aticity Diagram ( 1 9 3 1 )

  • For simplicity, we often

project to the 2D plane

  • Also normalize

X’+Y’+Z’=1 X’’ = X’ / (X’+Y’+Z’) Y’’ = Y’ / (X’+Y’+Z’) Z’’ = 1 – X’’ – Y’’

  • Note: I nside horseshoe

visible, outside invisible to eye

CI E uses

  • Find com plem entary colors:
equal linear dist ances from whit e in opposit e direct ions
  • Measure hue and saturation:
ext end line from color t o whit e t ill it cut s horseshoe ( hue) Sat urat ion is rat io of dist ances color -to -white/ hue -to -w hit e
  • Define and com pare device color gam ut (color ranges)
  • Problem : not perceptually uniform :
Sam e am ount of changes in different direct ions generat e

perceived difference t hat are not equal

CI E LUV - uniform

Color Spaces

  • CI E very exact, defined
  • Alternate lingo m ay be better for other dom ains
  • Artists: tint, tone shade
  • CG: Hue, saturation, lum inance
  • Many different color spaces
RGB CMY HLS HSV Color Model And m ore…..
slide-5
SLIDE 5

5

Com bining Colors: Additive and Subtractive

Additive (RGB) Subtractive (CMYK) Add com ponents Rem ove com ponents from white

Som e color spaces are additive, others are subtractive Exam ples: Additive (light) and subtractive (paint)

RGB Color Space

  • Define colors with (r, g, b) am ounts of red, green, and

blue

  • Most popular
  • Additive

CMY

  • Subtractive
  • For print ing
  • Cyan, Magenta, Yellow
  • Som et im es black ( K) is

also used for richer black

  • ( c, m , y) m eans subt ract

t h e c, m , y of t h e com plim ent s of C ( red) M ( gr een) and Y ( blue)

HLS

  • Hue, Light ness, Sat urat ion
  • Based on warped RGB cube
  • Look from ( 1,1,1) t o ( 0,0,0) or RGB

cube

  • All hues then lie on hexagon
  • Express hue as angle in degrees
  • 0 degrees: red
slide-6
SLIDE 6

6

HSV Color Space

  • A m ore intuitive color space
H = Hue S = Sat ur at ion V = Value ( or br ight ness)
  • Based on artist Tint, Shade,

Tone

  • Similar to HLS in concept

Value Saturation Hue Converting Color Spaces

  • Converting between color m odels can also be expressed

as such a matrix transform:

[ ] [ ]

          − − − − = 105 . 1 033 . 424 . 333 . 029 . 2 145 . 1 138 . 110 . 1 739 . 2 Z Y X B G R

Color Quantization

  • True color can be quite large in actual description
  • Sometimes need to reduce size
  • Exam ple: take a true- color description from database and

convert to web im age form at

  • Replace true- color with “best m atch” from sm aller subset
  • Quantization algorithm s:
Uniform quant izat ion Popularity algorithm Median-cut algorithm Oct ree algorit hm

Gam m a Correction

  • Color spaces, RGB, HLS, etc are all linear.
  • E.g. (0.1,0.1,0.1) in RGB is half the intensity of (0.2,0.2,0.2)
  • However, CRT I ntensity: I = kN γ
N is no. of elect rons hit t ing screen ( volt age) , relat ed t o pixel value k and γ are const ant s for each m onit or
  • Intensity- voltage relationship is non- linear, different m in/ m ax

N for different devices

  • Gam m a correction: m ake relationship linear, m atch up

intensity on different devices

  • How? I nvert above equation so that N = (I / k) 1/γ
  • Choose k and γ so that I becomes linearly related to N
slide-7
SLIDE 7

7

Gam m a Correction

  • Typical gam m a values in range [ 1.7 – 2.3]
  • E.g. NTSC TV standard in US defines gam m a = 2.2
  • Som e m onitors perform the gam m a correction in hardware

( SGI’s)

  • Others do not (most PCs)
  • Tough to generate im ages that look good on both platform s

(i.e. im ages from web pages)

Device Color Gam uts

  • Since X, Y, and Z are hypothetical light sources, no real

device can produce the entire gam ut of perceivable color

  • Depends on physical m eans of producing color on device
  • Exam ple: R,G,B phosphors on CRT m onitor

Device Color Gam uts

  • The RGB color cube sits within CI E color space
  • We can use the CI E chrom aticity diagram to com pare the

gamuts of various devices

  • E.g. com pare color printer and m onitor color gam uts

References

  • Hill, chapter 12