
SLIDE 1
1
Measurement Measurement-
- Based Modeling of
Based Modeling of I nternet Round I nternet Round-
- Trip Time Dynamics
Trip Time Dynamics using System I dentification using System I dentification
Hiroyuki Hiroyuki Ohsaki Ohsaki Department of Information Science and Department of Information Science and Technology, Osaka University, Japan Technology, Osaka University, Japan
- osaki@ist.osaka
- osaki@ist.osaka-
- u.ac.jp
u.ac.jp http://www. http://www.anarg anarg. .jp jp/ /
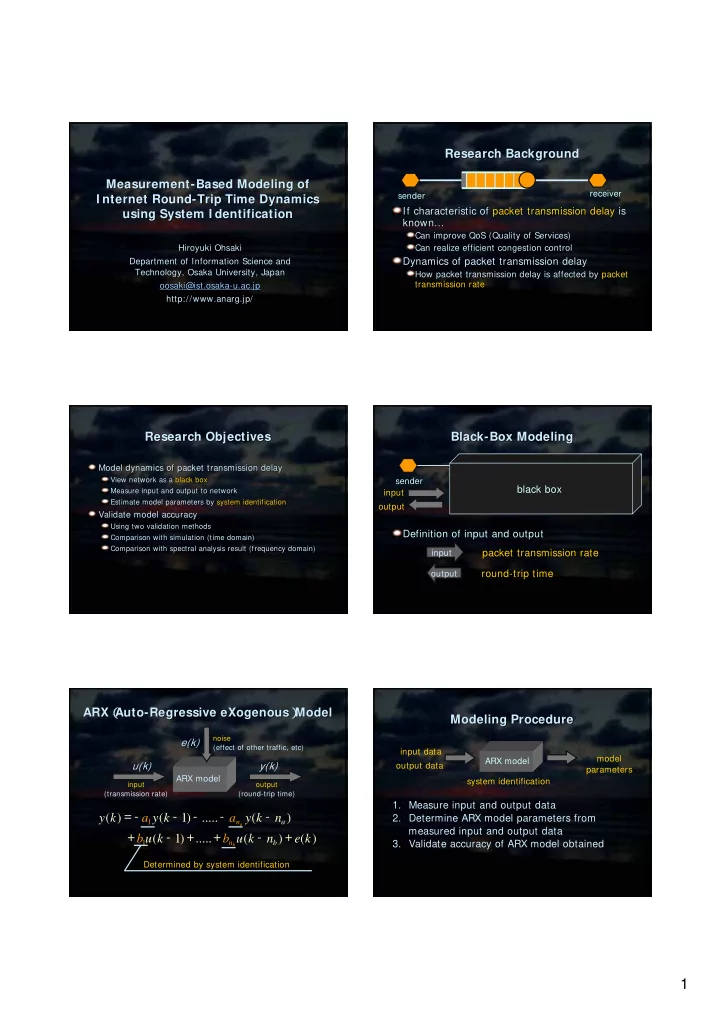
Research Background Research Background
If characteristic of If characteristic of packet transmission delay packet transmission delay is is known known… …
Can improve Can improve QoS QoS (Quality of Services) (Quality of Services) Can realize efficient congestion control Can realize efficient congestion control
Dynamics of packet transmission delay Dynamics of packet transmission delay
How packet transmission delay is affected by How packet transmission delay is affected by packet packet transmission rate transmission rate sender receiver
Research Objectives Research Objectives
Model dynamics of packet transmission delay Model dynamics of packet transmission delay
View network as a View network as a black box black box Measure input and output to network Measure input and output to network Estimate model parameters by Estimate model parameters by system identification system identification
Validate model accuracy Validate model accuracy
Using two validation methods Using two validation methods Comparison with simulation (time domain) Comparison with simulation (time domain) Comparison with spectral analysis result (frequency domain) Comparison with spectral analysis result (frequency domain)
receiver sender
Black Black-
- Box Modeling
Box Modeling
Definition of input and output Definition of input and output packet transmission rate round-trip time
input
- utput
input
- utput
black box
ARX ARX( ( Auto Auto-
- Regressive
Regressive eXogenous eXogenous) ) Model Model
ARX model
u(k) y(k) e(k)
input (transmission rate)
- utput
(round-trip time) noise (effect of other traffic, etc)
) ( ) ( ..... ) 1 ( ) ( ..... ) 1 ( ) (
1 1
k e n k u b k u b n k y a k y a k y
b n a n
b a
+
- +
+
- +
- =
Determined by system identification
Modeling Procedure Modeling Procedure
- 1. Measure input and output data
- 2. Determine ARX model parameters from
measured input and output data
- 3. Validate accuracy of ARX model obtained
model parameters system identification ARX model input data
- utput data