
SLIDE 1
1
1 Gene neral l Managers Report port Decembe cember r 2018 - - PowerPoint PPT Presentation
1 Gene neral l Managers Report port Decembe cember r 2018 Winter will not break us! 3 Patuxent Reservoirs Watershed Protection Group Annual Policy Board and Technical Advisory Committee Salt Summit
1
Winter will not break us!
3
6
Pressure sewer main break in Bowie
9
11
13
HomeServe
August 2016 – October 2018
Product Monthly Cost Contracts Completed Repairs HomeServe's Repair Cost/Customer Savings HomeServe's Estimated Revenue Water Service Line $3.99 74,559 1,910 $2,988,625 $6,025,925 Sewer/Septic Line $5.49 43,451 1,800 $1,043,874 $3,365,423 Bundle(WSL and SSL) $5.99 8,334 740 $756,300 $938,867 Interior Plumbing and Drainage $9.99 21,133 4,340 $1,459,056 $2,687,550 Total 147,477 8,790 $6,247,855 $13,017,765
$50,000,000 $55,000,000 $60,000,000 $65,000,000 $70,000,000 $75,000,000 $80,000,000 July Aug Sep Oct Nov Dec Jan Feb Mar Apr May June
FY 2019 Total Operating Revenue
FY 2019 Actual $20,000,000 $30,000,000 $40,000,000 $50,000,000 $60,000,000 $70,000,000 $80,000,000 Jul Aug Sep Oct Nov Dec Jan Feb Mar Apr May Jun
FY 2019 Net Operating Expenses
FY 2019 Actual
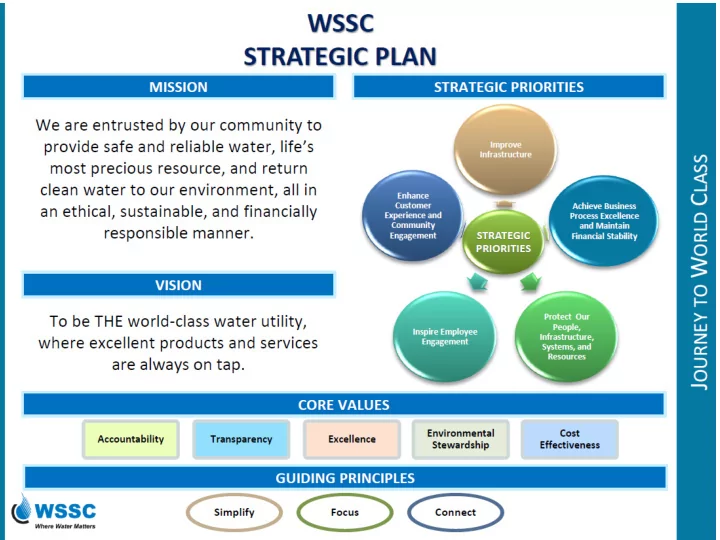
Achieve Business Process Excellence & Maintain Financial Stability Enhance Customer Experience & Community Engagement
December 2018 2017
98 New Customer Accounts 125 Concerns Closed 11 Total Compliments
$218,350,000 YTD $267,783,000 YTD
IssueTrakr November 2018
118 Concerns Opened
Billing : 28 Customer Service: 24 HomeServe: 1 Operations: 38 Quality of Service: 27
2,304 Total Customer Accounts
20 40 60 80 100 Jul Aug Sept Oct Nov Dec Jan Feb Mar Apr May Jun
Percent of Calls Answered
FY 2018 FY 2019 Target $0.00 $2,000,000.00 $4,000,000.00 $6,000,000.00 $8,000,000.00 $10,000,000.00 $12,000,000.00 $14,000,000.00 Jul Aug Sep Oct Nov Dec Jan Feb Mar Apr May Jun
Delinquent Accounts
Government Commercial Multi-Family Units Residential FY 2018 TOTAL
20 40 60 80 100 120 140 July Aug Sept Oct Nov Dec Jan Feb Mar Apr May Jun
Number of Days
Permanent Paving Work Orders Average Completion Time
Days to Complete FY19 Days to Complete FY18 Goal to Complete
Employee Engagement Improve Infrastructure
10 20 30 40 50 60 70 80 90 Jul Aug Sept Oct Nov Dec Jan Feb Mar Apr May Jun
Basement Backups
FY 2019 5 Yr Avg. 5 10 15 20 Jul Aug Sep Oct Nov Dec Jan Feb Mar Apr May Jun
Sanitary Sewer Overflows
FY 2019 5 Yr. Avg.
176 211 309 381 262 245 241 262 100 200 300 400 500 600 700
Eligible Now Eligible w/in 1 Yr Eligible w/in 3 Yrs Eligible w/in 5 Yrs
FY 2019 Eligible Retirements - Current and Future
As of October 2018
Full Retirement Early Retirement
20 40 60 80 100 120 140 Jul Aug Sep Oct Nov Dec Jan Feb Mar Apr May Jun FY 2019 Vacancies vs. Active Recruitments
FY 2019 Vacancies vs. Active Recruitments
Active Recruitments Inactive Recruitments Positions Filled
0.0 50.0 100.0 150.0 200.0 250.0 Jul Aug Sep Oct Nov Dec Jan Feb Mar Apr May Jun
MGD
Wastewater Treatment
Includes Wastewater Treated at Blue Plains FY 2018 FY 2019 0.0 20.0 40.0 60.0 80.0 100.0 120.0 140.0 160.0 180.0 200.0 Jul Aug Sep Oct Nov Dec Jan Feb Mar Apr May Jun
MGD
Water Production
FY 2018 FY 2019
6 90 139 13 Water Main Breaks & Leaks by Pipe Age November
Under 25 yrs 25-50 yrs Over 50 years Unknown 248 Total