Yemens Population and Development Challenges Outline I. - - PowerPoint PPT Presentation

yemen s population and development challenges outline
SMART_READER_LITE
LIVE PREVIEW

Yemens Population and Development Challenges Outline I. - - PowerPoint PPT Presentation

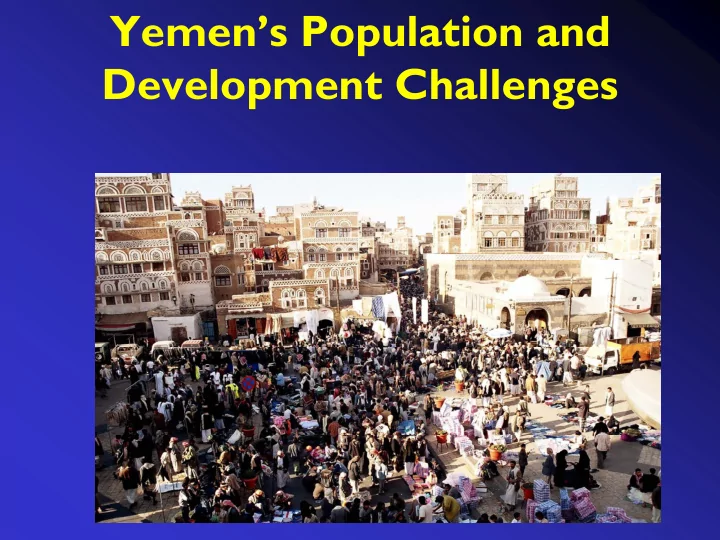
Yemens Population and Development Challenges Outline I. Population Characteristics and Projections II. Sectoral Impacts Economy Education Health Natural Resources III. Conclusions and Main Challenge Outline I.


slide-1
SLIDE 1

Yemen’s Population and Development Challenges

slide-2
SLIDE 2

Outline

I. Population Characteristics and Projections II. Sectoral Impacts

– Economy – Education – Health – Natural Resources

III. Conclusions and Main Challenge

slide-3
SLIDE 3

Outline

I. Population Characteristics and Projections II. Sectoral Impacts

– Economy – Education – Health – Natural Resources

III. Conclusions and Main Challenge

slide-4
SLIDE 4

Total Population 1950-2004

4.3 M

1950

19.7M

2004

slide-5
SLIDE 5

High Fertility Drives Yemen’s Rapid Population Growth

1 0 2 0 3 0 4 0 5 0 6 0 1 9 7 5 1 9 8 0 1 9 8 8 1 9 9 4 1 9 9 7 2 0 0 4 P e r T h o u s a n d

1.8% 3.7% 3.0% Crude Birth Rate Crude Death Rate Rate of Natural Increase

Rate of natural increase = birth rate – death rate

slide-6
SLIDE 6

Total Fertility Rate

(Births/Woman)

Yemen 6.1 Sudan 4.8 Syria 3.5 Egypt 3.2

Source: World Population Prospects the 2006 Review

slide-7
SLIDE 7

Who Have the Highest Fertility?

6.7

Rural

6.7 Yemen 6

No schooling

2.8

Urban

4.5

Secondary

  • r higher
slide-8
SLIDE 8

Infant Mortality Rate

6 9 .2 3 6 . 9 1 8 .6 7 2 .6

1 0 2 0 3 0 4 0 5 0 6 0 7 0 8 0

P e r 1 ,0 0 0 L i v e B ir t h s

Y e m e n E g y p t S y r ia S u d a n

Source: World Population Prospects the 2006 Review (Highlights)

slide-9
SLIDE 9

Under Five Mortality Rate

9 5 .4 4 2 2 1 . 5 1 1 8 .3

2 0 4 0 6 0 8 0 1 0 0 1 2 0

P e r 1 ,0 0 0 L i v e B i r t h s

Y e m e n E g y p t S y r ia S u d a n

Source: World Population Prospects the 2006 Review

slide-10
SLIDE 10

Maternal Mortality Ratio (Adjusted – 2000)

3 6 5 8 4 1 6 0 5 9 0

1 0 0 2 0 0 3 0 0 4 0 0 5 0 0 6 0 0

P e r 1 0 0 , 0 0 0 L i v e B i r t h s

Y e m e n E g y p t S y r ia S u d a n

Source: Human Development Report 2006.

Yemen Family Health survey 2003

slide-11
SLIDE 11

Fertility Assumptions for the Future

High assumption --- Fertility rate of 6 children per woman will continue up to 2035--- RED UN Moderate assumption--- Fertility rate declines from 6 to 3 children per woman by 2035--- ORANGE Low assumption---Based on National Population Policy, with fertility rate declining to 3.3 children per woman in 2025 and to 2.1 by 2035--- GREEN

slide-12
SLIDE 12

Estimated Future Population

1 0 2 0 3 0 4 0 5 0 6 0

2 0 0 8 2 0 1 3 2 0 1 8 2 0 2 3 2 0 2 8 2 0 3 3

H ig h L o w M o d e r a t e

61 43 46

Millions

23

slide-13
SLIDE 13

Outline

I. Population Characteristics and Projections II. Sectoral Impacts

– Economy – Education – Health – Natural Resources

III. Conclusion and Main Challenge

slide-14
SLIDE 14

Economic Sector

GDP per capita

$ 1,293

Syria Egypt

$ 1,085

Yemen

$ 631

Sudan

$ 594

Source: Human Development Report 2006.

slide-15
SLIDE 15

GDP Per Capita ($)

1 ,3 6 2 1 ,9 2 5 1 ,8 4 7

5 0 0 1 0 0 0 1 5 0 0 2 0 0 0 2 0 0 8 2 0 1 3 2 0 1 8 2 0 2 3 2 0 2 8 2 0 3 3 H ig h L o w M o d e ra t e

slide-16
SLIDE 16

1 3 .4 1 2 .0 2

5 6 7 8 9 1 0 1 1 1 2 1 3 1 4 2 0 0 8 2 0 1 3 2 0 1 8 2 0 2 3 2 0 2 8 2 0 3 3

M i l l i o n s

H ig h L o w M o d e r a te

Projected Labor Force

12.01

slide-17
SLIDE 17

Education Sector

Projected Student Enrollment: Basic

1 4 .7 8 .8

3 5 7 9 1 1 1 3 1 5 1 7 2 0 0 8 2 0 1 3 2 0 1 8 2 0 2 3 2 0 2 8 2 0 3 3

M illio n s

L o w H ig h M o d e ra t e

3.7

7.9

slide-18
SLIDE 18

Number of Students: Secondary

1 .7 2 .9 2 .0

0 .5 1 1 .5 2 2 .5 3 2 0 0 8 2 0 1 3 2 0 1 8 2 0 2 3 2 0 2 8 2 0 3 3 M illio n s

L o w H ig h M o d e ra t e

Source: Ministry of Education, 2004

slide-19
SLIDE 19

Required Number of Basic Teachers

2 6 4

1 2 5

4 9 0

3 5 3

1 0 0 2 0 0 3 0 0 4 0 0 5 0 0 2 0 0 8 2 0 1 3 2 0 1 8 2 0 2 3 2 0 2 8 2 0 3 3

T h o u s a n d s

L o w H ig h M o d e ra t e

slide-20
SLIDE 20

Required Number of Secondary Teachers

5 4 9 2

7 4

2 0 3 0 4 0 5 0 6 0 7 0 8 0 9 0 1 0 0 2 0 0 8 2 0 1 3 2 0 1 8 2 0 2 3 2 0 2 8 2 0 3 3

T h o u s a n d s

L o w H ig h M o d e ra t e

slide-21
SLIDE 21

Expenditures to Establish New Classrooms, 2008-2035

Low: $2.83 B High: $7.68 B Low: $651 M High: $1.27 B

Basic Secondary

Moderate: $3.78 B Moderate: $795 M

slide-22
SLIDE 22

Required Expenditures for Basic Students

8 8 7 1 6 4 6 4 1 9

9 8 9

4 0 0 9 0 0 1 4 0 0 1 9 0 0

2 0 0 8 2 0 1 3 2 0 1 8 2 0 2 3 2 0 2 8 2 0 3 3 M illio n $ L o w H ig h M o d e ra t e

slide-23
SLIDE 23

8 2 2 2 8 3 8 8

2 7 2

5 0 1 0 0 1 5 0 2 0 0 2 5 0 3 0 0 3 5 0 4 0 0 2 0 0 8 2 0 1 3 2 0 1 8 2 0 2 3 2 0 2 8 2 0 3 3

M i lli o n $ L o w H ig h M o d e ra t e

Required Expenditures for Secondary Students

slide-24
SLIDE 24

Number of Required Doctors

(same service ratio)

1 6 .4

5 1 0 1 5 2 0 2 0 0 6 2 0 1 2 2 0 1 7 2 0 2 2 2 0 2 7 2 0 3 2

T h o u s a n d s

L o w H ig h M o d e ra t e

12.1 11.6

Health Sector

slide-25
SLIDE 25

Number of Required Doctors

(assuming improved service ratio)

8 7 1 2 3 6

9 0

2 5 5 0 7 5 1 0 0 1 2 5 2 0 0 8 2 0 1 3 2 0 1 8 2 0 2 3 2 0 2 8 2 0 3 3

ﻒﻟﻷﺎﺑ

L o w H ig h M o d e ra t e

slide-26
SLIDE 26

Required Number of Hospital Beds

4 0 .5 1 5 .6 6 1 .3

4 5 .2

1 5 2 5 3 5 4 5 5 5 6 5 2 0 0 8 2 0 1 3 2 0 1 8 2 0 2 3 2 0 2 8 2 0 3 3

T h o u s a n d s

L o w H ig h M o d e ra t e

slide-27
SLIDE 27

Recurrent Health Expenditures

1 0 8 4 1 5 3 0 1 1 2 9

2 0 0 4 0 0 6 0 0 8 0 0 1 0 0 0 1 2 0 0 1 4 0 0 1 6 0 0 2 0 0 8 2 0 1 3 2 0 1 8 2 0 2 3 2 0 2 8 2 0 3 3

$ M illio n s

L o w H ig h M o d e ra t e

slide-28
SLIDE 28

Per Capita Arable Land

0 .0 4 0 .0 2 0 .0 6

0 .0 1 0 .0 2 0 .0 3 0 .0 4 0 .0 5 0 .0 6 0 .0 7 2 0 0 8 2 0 1 3 2 0 1 8 2 0 2 3 2 0 2 8 2 0 3 3 H e c t a r e p e r c a p i t a

L o w F e rt ilit y C o n s t a n t F e rt ilit y M o d e ra t e

0.04

Natural Resources

slide-29
SLIDE 29

Water Per Capita

2 0 4 0 6 0 8 0 1 0 0 1 2 0 1 4 0

2 0 0 8 2 0 1 3 2 0 1 8 2 0 2 3 2 0 2 8 2 0 3 3

C u b i c m e t e r s

H ig h L o w M o d e ra t e

66 44 62

120

slide-30
SLIDE 30

Required Water

8 3 9 2 5 5 5 3 . 3 0 7 5 6 1 9 2 2 0 0 0 3 0 0 0 4 0 0 0 5 0 0 0 6 0 0 0 7 0 0 0 8 0 0 0 9 0 0 0 2 0 0 8 2 0 1 3 2 0 1 8 2 0 2 3 2 0 2 8 2 0 3 3 M i l l i o n c u b i c m e t e r s H i g h L o w M o d e r a t e

slide-31
SLIDE 31

Electricity Per Capita

(current shortage is 25%)

5 0 1 0 0 1 5 0 2 0 0 2 5 0

2 0 0 8 2 0 1 3 2 0 1 8 2 0 2 3 2 0 2 8 2 0 3 3 K i l o w a t t / h o u r

H ig h L o w M o d e r a te

108 71

195

105

slide-32
SLIDE 32

Outline

I. Population Characteristics and Projections II. Sectoral Impacts

– Economy – Education – Health – Natural Resources

III. Conclusions and Main Challenge

slide-33
SLIDE 33

The Price to Pay For Continuing High Fertility

29 % less income per person 1.5 million new entrants to labor force 33% less water $ 5.5 billion to build new classrooms S447 million in 2035 for recurrent health exp.

slide-34
SLIDE 34

Can we do it?

slide-35
SLIDE 35

Population Growth and Economic Development

2 0 4 0 6 0 8 0 1 0 0 1 2 0 1 4 0 1 6 0 1 8 0 2 0 0 2 0 0 4 2 0 1 4 2 0 2 4 2 0 3 4 2 0 4 4 2 0 5 4 2 0 6 4 2 0 7 4 2 0 8 4 2 0 9 4 M illio n s

U n m e t N e e d S a tis fie d U N M e d iu m P r o je c tio n C u r r e n t S itu a tio n

slide-36
SLIDE 36

Main Challenge: High Fertility Due to Low Family Planning Use and High Unmet Need

Married women:

  • 51% have unmet

need for FP

  • Only 23% use FP
  • Have limited access

to RH/FP services

Married women, Ages 15-49 51% 23%