
SLIDE 1
4th May 2017
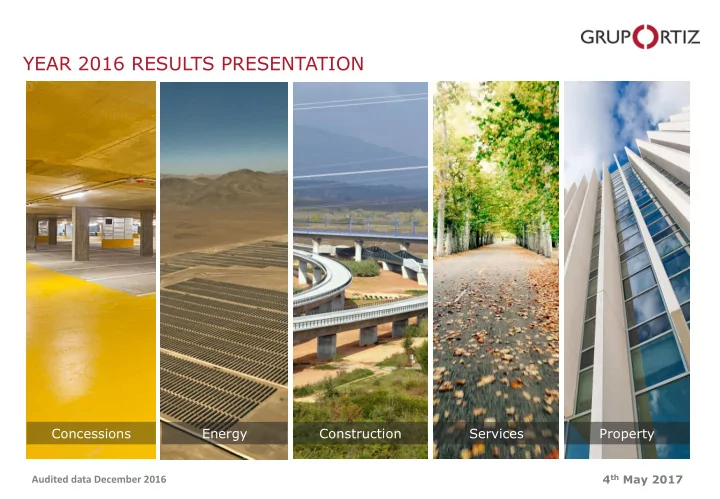
YEAR 2016 RESULTS PRESENTATION
Property Services Energy Concessions Construction
Audited data December 2016
YEAR 2016 RESULTS PRESENTATION Concessions Energy Construction - - PowerPoint PPT Presentation
YEAR 2016 RESULTS PRESENTATION Concessions Energy Construction Services Property 4 th May 2017 Audited data December 2016 INDEX 1. Year 2016 turnover and EBITDA 4-5 2. Year 2016 financial statements 7 3. Year-end 2016 backlog 9 4.
4th May 2017
Audited data December 2016
1. Year 2016 turnover and EBITDA 4-5 2. Year 2016 financial statements 7 3. Year-end 2016 backlog 9 4. Internationalisation 11-12 5. Reorganisation of leased fixed assets 14 6. Energy division summary 16 7. Concessions division summary 18-20 8. Consolidated debt analysis 22 9. Year 2015 and 2016 ratios 24 10. Cash flow 26 11. Year 2016 significant events 28 12. 2016-2020 Strategic plan 30-31 13. Key business drivers 33 2
Audited data December 2016
3
Data in millions of euros (*) Includes data from concessions which do not consolidate in the annual accounts in the corresponding percentage (they are added using the equity method)
VARIATION 2015 - 2016 VARIATION 2015 - 2016
4
Audited data December 2016
2016 TURNOVER (*) 2016 EBITDA (*)
Data in millions of euros (*) Includes data from concessions which do not consolidate in the annual accounts in the corresponding percentage (they are added using the equity method) ** EBITDA from dependant concessions includes cash-flow and earned interests from concessions that do not consolidate
5
35% 16% 36% 1% 12% CONSTRUCTION SERVICES ENERGY ASSETS CONCESSIONS
22% 9% 16%
54%
CONSTRUTION SERVICES ENERGY ASSETS CONCESSIONS
2016 TURNOVER % 2015-16 EBITDA 2016 % 2015-16 2016 MARGIN BUSINESS DIVISION CONSTRUCTION (Nat. and Internat.) 134,56 14,39% 13,50 16,58% 10,03% SERVICES 61,00 0,08% 6,02
9,87% ENERGY 138,77 5,70% 10,56
7,61% ASSETS 3,20
DEPENDENT CONCESSIONS 9,63
6,27**
65,11% CONSOLIDATED GROUP TOTAL 347,16
35,90
10,34% + INDEPENDENT CONCESSIONS 39,00
29,11 0,72% 74,68%
GROUP TOTAL (*) 386,16
65,01
16,83%
Audited data December 2016
6
Data in thousands of euros
GRUPO ORTIZ CONSOLIDATED UNAUDITED YEAR 2016 FINANCIAL STATEMENTS
7
* Concessions that do not consolidate: € 1,13 M “Urbanizadora Gade”: € -6,894 M unfavourable judgement by which the patrimonial tax regime is not applicable ** This paragraph include a -EUR 6.255m provision for (i) the tax deeds of Urbanizadora Gade for the fiscal periods 2005-2007, which are pending judgment (from the “Audiencia Nacional” high court), (ii) the amount owed to O.A.I. as a result of the favorable verdict which allowed it to apply a +EUR4.377m (+EUR1.045m interests) tax deduction for double taxation as shareholder of Urbanizadora Gade.
Profit and Loss statement
December 2016 December 2015
347,159 376,252
203 588
265 739
5 18
187 906
3,170 1,814 Results of the loss of control in consolidated shareholding
Negative impact of combination of businesses
26,402 33,506
3,771 4,748
360
2,295
604
Other financial income and expenses
A.2) Financial profit/loss
Profit / (loss)-sharing of companies based on the Equity Method
Impairment and profit/losses due to loss of significant influence
Negative difference of consolidation based on the Equity Method 11 53 A.3) Rprofit /loss before taxes (EBT) 10,622 17,506 19.Corporate profit tax
A.4) Financial Year consolidated profit/ lss from continuous operations 4,973 15,934 B) Interrumted operations 387
5,360 15,934
Audited data December 2016
8
Data in millions of euros (*) Includes data from concessions which do not consolidate in the annual accounts in the corresponding percentage (they are added using the equity method)
GRUPO ORTIZ ‘S YEAR-END 2016 BACKLOG VERSUS YEAR-END 2016 2015 BACKLOG
+30% +4%
▪ Total backlog as of 31st December 2016: € 4,13 billion ▪ Energy backlog: 30% increase versus 31st December 2015 ▪ International construction backlog has dropped mainly due to the removal of Algeria now pending arbitration ▪ International backlog: 52% of the Total backlog, 57% of the Construction backlog and 80% of the Energy backlog Backlog / Turnover (Construction + Services + Energy divisions): 3,19 years 9
321,97 525,59 342,11 61,90 2.927,97 270,75 353,70 443,68 55,02 3.012,00 0,00 500,00 1.000,00 1.500,00 2.000,00 2.500,00 3.000,00 3.500,00 Domestic CONSTRUCTION +SERVICES International CONSTRUCTION Domestic and International ENERGY PROPERTY CONCESSIONS (*) 2015 2016
Audited data December 2016
10
7
Implemented in the country With energy and water treatment projects
Datos Auditados de Diciembre 2015
MEXICO ENERGY
PANAMA CONSTRUCTION
COLOMBIA CONCESSIONS
CONSTRUCTION
PERU CONSTRUCTION
ENERGY
ROMANIA Integrated Water Management GUATEMALA Photovoltaic power plant O&M EL SALVADOR CONSTRUCTION 10 MW Photovoltaic power plant EPC HONDURAS Photovoltaic power plant O&M CHILE CONSTRUCTION 50 MW Photovoltaic power plant EPC FRANCE
Photovoltaic power plant O&M
ITALY
Photovoltaic power plant O&M
JAPAN CONSTRUCTION Photovoltaic power EPCs
INTERNATIONAL EXPANSION STRATEGY Implemented in Latin American countries with sustained growth and legal stability (Colombia, Peru, Panama and Mexico) Energy EPC from clients all over the world (projects in Japan, Chile, Honduras, Guatemala, El Salvador and Mexico)
11
Audited data December 2016
▪ International Turnover of the whole Group: 45% ▪ International Turnover of the Energy Division : 85%
BACKLOG AS OF 31ST DECEMBER 2016 Data in millions of euros (*) Includes data from concessions which do not consolidate in the annual accounts in the corresponding percentage (they are added using the equity method)
TURNOVER OF YEAR 2016
12
72% 28%
Construction
Domestic Construction International Construction
15% 85%
Energy
Domestic Energy International Energy
43% 57% Construction
Domestic Construction International Construction
20% 80% Energy
Domestic Energy International Energy
13
100% ORTIZ
*Data in millions of euros
Equity (2016): € 18,917 M + Reserves € 54,779 M = € 73,696 M Equity (today): € 23,017 M + Reserves € 67,072 M = € 90,089 M
RICS Appraisal for leased fixed assets: € 150,27 M
La Gavia Office (plot 2.50) 19,07 La Gavia Office (plot 2.72) 20,04 La Gavia Office (plot 2.91) 20,04 Aldi 2,47
RICS Aldigavia Oficinas S.A.U. 30,000 m2
Colmenar Viejo 97 homes 14,20 Paracuellos 180 homes 21,55 Alcalá de Henares 80 homes 8,72
RICS Aldigavia S.A.U. 25,496 m2
Car park 18,32
RICS Ortega y Gasset Park S.A.U. 24,258 m2
Other assets: 19,361 m2 Offices: 3,028 m2 Business premises: 2,356 m2 Warehouses: 6,015 m2 Business premises: 22 business premises Garage Stalls 159 stalls Service Station RICS Appraisal Total : € 25,86 M RICS Appraisal Total : € 61,62 M RICS Appraisal Total : € 44,47 M RICS Appraisal Total : € 18,32 M
100% GOP 100% GOP 100% GOP 14
15
EXPERIENCE COMPLETED AND CONTRACTED PIPELINE
It has BUILT (EPC) more than 450 MW for different types of power sources: Photovoltaic power (EPC) 317 MWp Wind power (EPC) 50 MW Solar thermal power (EPC) 50 MW Hydroelectric power (EPC) 1 MW Cogeneration power (EPC) 4,2 MW
Specialists in HV Lines and Substations:
T & D (20 KV-500 KV) 400 km Substations (20KV&220KV) 760 MVA
Specialists in Operation and Maintenance of more than 327 MW for different types of power sources:
Photovoltaic power (O&M) 227 MWp Solar thermal power (O&M) 50 MW Nuclear power (O&M): Trillo & Almaraz Others (O&M): Building Energy Maintenance and Services/Lighting
Under study (more than 2,240 MW)
Namibia 43 MW Alten
It has COMPLETED in 2016 (EPC) more than 50 MW in the following countries: 50 MW Uribe photovoltaic power plant in Chile for X-Elio (EPC) (completed in December 2016) CFE (Mexico): Substations and Transmission lines (EPC) (under construction) Elecor and Juan Galindo: electric substation for the Uribe photovoltaic power plant in Chile It has CONTRACTED in 2016 (EPC) more than 322 MW in the following countries: 3 photovoltaic plants in Japan (EPC) 22 MW (under construction) Photovoltaic plant in El Salvador (EPC) 10 MW (under construction) 2 photovoltaic plants in Mexico (EPC) 150 MW + 150 MW (Aguascalientes for Cubico-Alten) Almaraz Nuclear Power Plant electrical maintenance contract Adolfo Suárez Barajas Airport electrical maintenance contract
MAJOR CLIENTS
Gestamp Solar / X-Elio Trina Solar Grupo Borja Grupo Onyx / Anacapri Cubico and Alten CFE (Mexico) Endesa Union Fenosa AENA Trillo Nuclear Power Plant Almaraz Nuclear Power Plant
Mexico 2,000 MW
Nigeria 100 MW Alten
12
16
Japan 100 MW
Audited data December 2016
17
Car parks Petrol Station
Energy Efficiency
Others
100% Grupo Ortiz Concessions (Consolidated)
21,31 4,20 3,87 0,00 29,38
TOTAL
Equity Contributed at Source
▪ Group cash-flow + accrued interests: € 2,07 M ▪ Group contributions: €12,72M
Energy Roads and Railways
DOMESTIC Concessions in Operation
Consolidated by means of the equity method
75,14 11,42 4,87
Others
Equity Contributed at Source Turnover EBITDA
28,68 8,28 2,04 21,25 7,27 0,59
TOTAL
91,43 39,00 29,11
Turnover EBITDA
3,59 4,23 0,71 1,10 9,63 2,09 0,40 0,40 0,18 3,07
Conexión Norte Transv Sisga Ruta Caribe
INTERNATIONAL Concessions in Investment (Colombia)
Consolidated by means of the equity method
11,88
6,73
TOTAL
21,11
Equity Contributed at Source
2016 SIGNIFICANT EVENTS
private initiative
México
financial close
refinancing
Turnover EBITDA
18
▪ Group cash-flow to Ortiz: € 9,36 M ▪ Accrued interests: € 1,13 M
* EBITDA Dependent Concessions = (Group cash-flow from Concessions which do not consolidate) + (EBITDA from concessions that consolidate) + (accrued interests) = 6,27 = 2,07 + 3,07 +1,13
2,50
Data in millions of euros
Audited data December 2016
❖ Length: 137 km ❖ 100% reconditioning ❖ Cundinamarca, Boyacá y Casanare (Sisga–Guateque–San Luis de Gaceno–Aguaclara) ❖ SPV: Concesion del Sisga S.A.S. ❖ Construction Term: October 2016 – October 2019
❖ Under construction
❖ Concession Term: 2015 – 2044
❖ COFIDES entry: ≈ 14.50%
❖ Investment: ≈ € 285 M ❖ Bank financing: ≈ € 197 M ❖ ANI approval in June 2016 ❖ Signing forecasted for Q2 2017 ❖ Leverage : 70% / 30% ❖ CAF-AM Ashmore Fund / Corpbanca / Davivienda ❖ Due Diligences in their final phase ❖ Forecasted SPV Equity: € 88 M ❖ Forecasted ORTIZ Equity: € 35 M (10% already disbursed)
❖ Forecasted SPV Revenue: € 1.470 M
❖ Availability payments (40%) ❖ Direct soft toll (pre-existing) (35%) ❖ Toll revenue from the Government (25%) TRANSVERSAL DEL SISGA ❖ Length: 354 km ❖ doubling to dual-carriage way and reconditioning ❖ Cartagena - Barranquilla
❖ Awarded
❖ Feasibility study: submitted April 2016 ❖ Concession Term : 2017 – 2052
❖ Investment: ≈ € 832 M
❖ Forecasted bank financing: ≈ € 465 M (investment – profit during construction) ❖ Forecasted SPV Equity: € 157 M ❖ Forecasted ORTIZ Equity: € 47 M
❖ Forecasted SPV Revenue: € 6,350 M
❖ 100% direct toll (pre-existing) ❖ Very consolidated traffic volume AUTOPISTAS DEL CARIBE (private initiative)
19
❖ Length: 145 kms ❖ 63 km new construction ❖ 82 km reconditioning ❖ Antioquia (Remedios–Zaragoza – Caucasia) ❖ SPV: Autopistas de Nordeste, S.A.S. ❖ Construction Term: February 2016 – January 2021
❖ Under construction
❖ Concession term: 2015 – 2043
❖ COFIDES entry: ≈ 4.25%
❖ Investment: ≈ € 565 M ❖ Bank financing: ≈ € 425 M ❖ Signed in July 2016 ❖ Leverage: 75% / 25% ❖ Dollars (USD): USD 250 M Sumitomo / BCP / ICO / Korea Dev. Bank ❖ Pesos (COP): COP 587.187 M Bancolombia / Davivienda / FDN ❖ Forecasted SPV Equity: € 140 M ❖ Forecasted ORTIZ Equity: € 23.5 M (30% already disbursed)
❖ Forecasted SPV Revenue: € 2,830 M
❖ Availability payments (45%) ❖ Direct soft toll (10%) ❖ Toll revenue from the Government (45%) CONEXIÓN NORTE
Audited data December 2016
Mexico Peru Guatemala Uruguay Colombia
Energy
❖
Solar thermal power plant 50MW
❖
2 Wind farms 50MW
❖
8 Photovoltaic power plants 32 MW
❖
3 Energy Efficiency contracts
Shadow toll roads and railways
❖
Highway from the airport to Ibiza 7,8 km
❖
A-31 Highway (Bonete-Alicante) 111 km
❖
Olmedo-Pedralba high-speed railroad: 205 km
Car parks
❖
3,878 stalls in 8 car parks (7 in Madrid and 1 in Zamora)
Other infrastructure
❖
Water treatment plant
❖
Cultural center
❖
Sports center (4,600 members)
❖
Petrol station (4.5 millon litres/year)
❖
Restaurant
Guatemala
➢ Government offices complex 300,000 m2 € 300 M investment ➢ Escuintla-Puerto Quetzal 46 km highway € 60 M investment Uruguay ➢ 5 highways (5 PPP) 1,137 km highway € 410 M investment
Colombia
➢ Sinu road (Ortiz private initiative pre- feasibility submitted) 120 km highway € 275 M investment ➢ Hydro power (<20 MW) ➢ CAN Government offices complex 100,000 m2
Mexico
➢ Hospital Tepic Nayarit (private initiative) 150 beds € 60 M investment ➢ Gas pipelines
Peru
➢
Longitudinal de la Sierra Tranche 4 970 km highway € 340 M investment ➢ Vial de la Sierra (private initiative) 290 km highway € 75 M investment
Audited data December 2016
21
Data in millions of euros
22
174,31 168,27 160,32 149,31 2015 2016
Evolution of FINANCIAL DEBT
Total Debt Non recourse Debt 84,90 92,52 39,05 33,31 2015 2016
Evolution of BANK DEBT
Total Working Capital Debt Total Project Debt 50 50 50 2014 2015 2016
BOND DEBT
(2014 diversification of financing sources)
Bonds
* Ortiz’s treasury stock: 16,3 M 1,77 1,74 1,78 1,79 1,72 9,84 50 9,6 13,20 15,60 16,80 2017 2018 2019 2020 2021 All
years Long term debt REPAYMENT calendar: . Project debt with recourse . SYNDICATED LOAN tranche A . Bond debt * Ortiz’s treasury stock: € 16,3 M Syndicated Loan tranche A repayments Bond Debt committed repayments Long Term Project Debt committed repayments
66,9 100,66 90,88 48,64 2015 2016
NON-RECOURSE NET DEBT
Active Positions Non recourse Net Debt
56,94 67,33 100,66 48,3 72,5 75,4 28,41 32,33 25,07 2014 2015 2016
Evolution of TOTAL LIQUIDITY
Liquid positions Available from policies Available factoring
133,65 172,16 201,13
Audited data December 2016
23
Data in millions of euros
NET DEBT / EBITDA RATIO (TOTAL DEBT) 2,60 2,19 NET DEBT / EBITDA RATIO (ONLY DEBT WITH RECOURSE )
NET DEBT / EBITDA RATIO (TOTAL DEBT) 1,68 1,37 NET DEBT /EBITDA RATIO (ONLY DEBT WITH RECOURSE )
CONSOLIDATED GRUPO ORTIZ :
INTEREST COVER
REVENUE – EXPENDITURE - INTERESTS 10,94 EBITDA 34,983 RATIO 3,18
PROJECT DEBT :
24
41,22 90,47 GRUPO ORTIZ Net Financial Debt EBITDA CONSOLIDATED GRUPO ORTIZ : 35,60 48,64 GRUPO ORTIZ Net Financial Debt EBITDA
30,84 283,04 Concessions equity method Net Financial Debt EBITDA 95% of Net Financial Debt is non-recourse 9,18
Audited data December 2016
25
Data in millions of euros
26
Audited data December 2016
27
CONCESISONS 28TH JULY 2016: CONEXIÓN NORTE financial agreements signed
Sumitomo Mitsui, KDB, ICO, BCP
Bancolombia, Davivienda and FDN 30TH DECEMBER 2016: COFIDES share purchase agreement signed for entry into SPVs:
TRANSVERSAL DEL SISGA
RUTA DEL CARIBE HIGHWAY (private initiative)
SINÚ HIGHWAY (private initiative):
ALTEN CUBICO awarded 290 MW
and 140 MW) ZAMORA CAR PARK:
attained and refinancing the concession ENERGY CONSTRUCTION CFE (Mexican Federal Electricity Board)
X-ELIO
completed December 2016 TRINA SOLAR
MW photovoltaic plant in Japan for € 60 M
Japan (1 and 2 MW) signed in Nov. 2016
photovoltaic projects in Italy ALTEN CUBICO
Mexico (290 MW) for $280M POTENZA (GRUPO BORJA)
signed in October 2016 contract for €14M VESTAS
in Latin America OFFERS FOR EPC TENDERS
ELECOR: electric maintenance contracts
DOMESTIC CONSTRUCTION
PANAMA
Cathedral under construction
projects COLOMBIA
ASSET REAL ESTATE INVESTMENT TRUST (SOCIMI)
creating a new company (GRUPO ORTIZ PROPERTIES S.A.)
assets
(REIT / SOCIMI) Repurchase of bonds listed on the alternative fixed income market (MARF) (treasury stock)
28
FINANCING
Audited data December 2016
29
Turnover/EBITDA 2015 2016 2017 2018 2019 2020 TOTAL
2016-2020 Growth rate (%)
34,5% 20,1% 13,0% 9,1%
Aggregated turnover 399,3 373,5 502,5 603,5 681,8 743,6 2.904,9 Domestic Construction division 80,4 102,6 124,1 126,9 136,7 150,0 Domestic Services division 60,5 61,0 62,0 63,0 64,0 65,0 International and domestic Energy division 144,8 148,7 225,0 285,0 315,0 330,0 International Construction division 46,8 42,0 84,9 120,0 150,0 190,0 Property division (which consolidates) 55,3 5,6 1,6 3,5 10,9 3,1 Concessions division (which consolidates) 11,5 10,4 4,9 5,1 5,3 5,5 Arrears interests and Cash-flow from Concessions which do not consolidate 0,0 3,2 5,1 5,4 5,9 6,7
EBITDA / Turnover (%) 8,8% 10,9% 10,5% 8,1% 8,1%
Consolidated Group EBITDA 41,2 32,8 54,8 63,5 55,0 60,5 266,7 Domestic Construction division 6,0 7,2 8,7 8,9 9,6 10,5 Domestic Services division 6,2 4,3 4,3 4,4 4,5 4,6 International and domestic Energy division 15,2 8,9 13,5 17,1 18,9 19,8 International Construction division 5,6 2,9 5,9 8,4 10,5 13,3 Property division (which consolidates) 1,3 3,9 0,6 2,4 2,1 1,9 Concessions division (which consolidates) 4,7 2,4 0,5 0,7 1,1 1,1 Cash-flow from Concessionas which do not consolidate 2,3 1,2 2,6 2,9 3,4 4,2 Sale of REIT/SOCIMI 51,0% 0,0 0,0 14,0 14,0 0,0 0,0 Cash-flow from REIT/SOCIMI(49% + management fee) 0,0 0,0 2,2 2,3 2,5 2,6 Arrears interests 0,00 2,0 2,5 2,5 2,5 2,5
30
Audited data December 2016
Cash flow generation 2015 2016 2017 2018 2019 2020 TOTAL
Group Consolidated EBITDA 32,8 54,8 63,5 55,0 60,5 266,7
Cash flow available for debt service 24,2 39,0 71,5 59,0 64,5
258,2
Financial expenditure
Debt repayments
Planned investments
0,0
Planned divestments 20,0 2,3 13,2 7,6 0,0 43,1 Tax
Dividends
Free cash flow
3,9 23,2
8,2 3,2 Accumulated cash on balance 66,9 52,0 55,9 79,1 61,8 70,1 70,1
2015 2016 2017 2018 2019 2020
Consolidated financial debt 174,3 148,4 127,3 103,2 60,7 43,0 Year-end cash position 66,9 52,0 55,9 79,1 61,8 70,1 Net financial debt 107,4 96,4 71,4 24,0
Net financial debt (with recourse) 90,9 85,4 60,4 13,0
31
Audited data December 2016
32
ENERGÍA DEUDA
33
Audited data December 2016