WITH CONTRIBUTION FROM S Strack, P Davis & W Raskob Acute - - PDF document

with contribution from s strack p davis amp w raskob
SMART_READER_LITE
LIVE PREVIEW

WITH CONTRIBUTION FROM S Strack, P Davis & W Raskob Acute - - PDF document

Sang Bog Kim, Dan Galeriu & Anca OBT formation at night time, data and modelling trials Melintescu WITH CONTRIBUTION FROM S Strack, P Davis & W Raskob Acute tritium exposure experiments at night. Experiment Exposure Time Exposure


slide-1
SLIDE 1

OBT formation at night time, data and modelling trials

Sang Bog Kim, Dan Galeriu & Anca Melintescu

WITH CONTRIBUTION FROM S Strack, P Davis & W Raskob

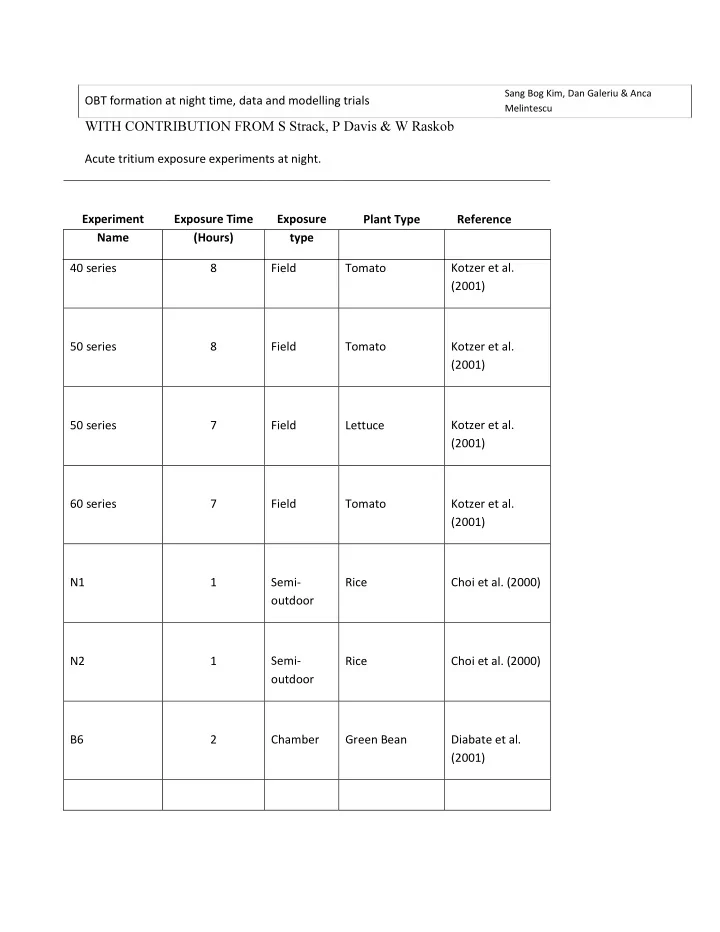
Acute tritium exposure experiments at night. Experiment Name Exposure Time (Hours) Exposure type Plant Type Reference 40 series 8 Field Tomato Kotzer et al. (2001) 50 series 8 Field Tomato Kotzer et al. (2001) 50 series 7 Field Lettuce Kotzer et al. (2001) 60 series 7 Field Tomato Kotzer et al. (2001) N1 1 Semi-

  • utdoor

Rice Choi et al. (2000) N2 1 Semi-

  • utdoor

Rice Choi et al. (2000) B6 2 Chamber Green Bean Diabate et al. (2001)

slide-2
SLIDE 2

Sw,WW 1 field wheat Strack 1997 D1 8 chamber rice Ichimasa 2002 D2 8 chamber soybeam Ichimasa 2003 T6 1 field tomato

Kim et al (2005).

  • 1. Diabate & Strack 1994,

Qualitative results, HTO in experimental chamber slow decay, CO2 limitation

In plants, tritium may be incorporated into organic molecules by metabolic reactions dependent on light and reactions independent of light. The first category includes the photosynthetic carbon reduction (Calvin cycle), using reduction equivalents (NADPH/H+) formed by photolysis of water, and isomeric reactions of the resulting sugar monophosphates. The Calvin cycle cannot be maintained in the absence of light because NADPH/H+ and ATP are not available. In autotrophic organisms like green plants, photosynthesis is essential for de-nave synthesis of organic material, and consequently for the growth. The second category of processes includes anabolic and catabolic reactions that occur independently of light using

  • rganic material for energy supply, growth and maintenance of the plant structure. There is no autotrophic

synthesis of organic material, but there is a conversion of one type of organic compounds to another type, as in heterotrophic organisms.

Leaf HTO/airHTO , ¼ Stomata closure NOT complete

  • 2. Strak and Diabate 1995-1996 field experiment, better conditions

Seed-OBT: All observed OBT concentrations in grain at harvest are close to a median of 0.14 %, related to the TWT concentrations in the leaves at the end of the exposure. Only in one case the relative OBT concentration amounts 0.4 % (exposure at 20:00 h, 1995). This measuring point seems to represent an artefact, however, This equality of the endpoints is an unexpected result. Taking into consideration a distinct variation of the climatic conditions during the exposure, one would expect that the final OBT concentrations should show a diurnal fluctuation with a minimum in the early morning as well as in the night, and a maximum when the plants are exposed during morning and afternoon. From a compilation of all calculated OBT concentrations such a diurnal dependence is recognisable, if climatic variations are considered. In fig. xx such a trend is included by a polynomal fit of all lined up endpoint calculations. The plant-OBT model estimates a

SW 2 Chamber Spring Wheat Diabate and Strack (1997)

slide-3
SLIDE 3

maximum relative OBT concentration of 0.45 % in grain when the plants were exposed from 10:00 to 11:00 in 1995. Minimum concentrations below 0.1 % were calculated for 7:00 in the morning (1996) and for 23:00 in 1995. The median of all calculated reative OBT concentrations in grains amounts 0.2 %.

slide-4
SLIDE 4

OBT con. in seeds at harvest related to TWT

y = 0,0003x3 - 0,0174x2 + 0,2723x - 1,0123 0,00 0,05 0,10 0,15 0,20 0,25 0,30 0,35 0,40 0,45 0,50 6 8 10 12 14 16 18 20 22 24

time of day [h], beginning of exposure % relative seed OBT rel meas seed OBT rel mod polynomic fit - seed OBT rel mod median OBT maes =0.14 % rel.

Ear/leaf TWT related to atmospheric HTO

20 40 60 80 100 120 140 f-3 7 h f-14 7 h f-7 8 h f-2 9 h f-4 10 h f-10 11 h f-15 11 h f-1 14 h f-9 15 h f-13 15 h f-5 20 h f-11 20 h f-6 23 h f-12 23 h earTWTmeas leafTWTmeas earTWTmod leafTWTmod

slide-5
SLIDE 5

Uptake of Atmospheric HTO into TWT of Wheat Plants in Dependence on the Time of exposure.

Leaf TWT related to atmospheric HTO

20 40 60 80 100 120 f-3 7 h f-4 10 h f-1 14 h f-9 15 h f-11 20 h f-12 23 h leafTWTmeas leafTWTmod

slide-6
SLIDE 6

Relative TWT concentrations at the end of exposure to HTO in % (100 % = average HTO concentration in air humidity) Plant parts Exposure at Sunrise Exposure in the Morning Exposure in the Afternoon Exposure at Sunset Exposure at Night leaves 26 - 74 53 - 100 63 - 90 20 - 26 18 - 19 stems 4 - 12 10 - 24 14 - 19 3 - 5 3 ears 9 - 15 14 - 23 5 - 25 6 - 10 6

slide-7
SLIDE 7

Relative OBT concentration at the end of exposure to HTO in % (100% = TWT concentration in leaves at the end of exposure)

slide-8
SLIDE 8

Plant parts Exposure at Sunrise Exposure in the Morning Exposure in the Afternoon Exposure at Sunset Exposure at Night leaves 0.5 - 0.8 0.9 - 1.4 1.5 0.4 - 0.5 0.4 stems 0.1 0.1 0.2 0.1 0.1 ears 0.1 - 0.2 0.2 - 0.3 0.3 0.2 0.1

slide-9
SLIDE 9
  • 3. Experiments in CANDA, Tomato, Observations by P Davis

Dependence on Stage of Growth: The HTO concentration in the leaves immediately after exposure (normalized by the average HTO concentration in the air moisture in the chamber) was lowest for mature plants. HTO loss rates from the fruit were higher for plants exposed in the early stage of growth than in the intermediate stage, and higher for the intermediate stage than for the mature stage. The maximum OBT concentration in the leaves (normalized by the leaf HTO concentration at the end of the exposure) decreased as the plants were exposed at later growth stages. The biological half-life for OBT in leaves was short (<25 days) for the experiments involving plants at early and mature late growth stages, but longer (40 days) for plants in which the fruit had just started growing. The OBT concentrations in leaves at the time of the last measurement (normalized by the leaf HTO concentration at the end of exposure) increased for later growth stages . The OBT concentrations in fruit at harvest (normalized by the leaf HTO concentration at the end of exposure) increased for later growth stages. Dependence on Time of Day (for mature plants only): The HTO concentration in the leaves immediately after exposure (normalized by the average HTO concentration in the air moisture in the chamber) was about three times higher for the daytime exposure as for the nighttime exposure. The HTO concentration in the leaves following nighttime exposure remained steady or decreased only slowly until sunrise. In contrast, the HTO concentration in the leaves following daytime exposure began to drop off as soon as the exposure ended. The period of increasing OBT concentration in the leaves was shorter (2 to 6 hours) in the daytime experiments than in the nighttime experiments (>2 hours).

slide-10
SLIDE 10

The maximum OBT concentration in the leaves (normalized by the leaf HTO concentration at the end of the exposure) was higher for the daytime experiments than for the nighttime experiments. The biological half-life for OBT in leaves following daytime exposure was shorter than the half-lifes observed in the nighttime experiments. The OBT concentration in leaves at the time of the last measurement (normalized by the leaf HTO concentration at the end of exposure) was higher for the daytime exposure than for the nighttime exposure. The biological half-life of OBT in fruit was lower for the daytime experiment than for the nighttime experiments. The OBT concentration in fruit at harvest (normalized by the leaf HTO concentration at the end of exposure) was lower for the daytime exposure than for the nighttime exposure

Experiment HTO OBT OBT/HTO Concentration in Concentration in Ratio Days after the Leaf (Bq/L) the Fruit (Bq/L) Exposure toHarvest

1 3.96 x 10⁷ 1.41 x 10³ 3.56 x 10⁻⁵ 90 3 3.48 x 10⁷ 5.70 x 10³ 3.56 x 10⁻⁵ 90 5 4.43 x 10⁷ 2.24 x 10⁵ 5.06 x 10⁻³ 42 7 5.27 x 10⁷ 2.32 x 10⁴ 4.40 x 10⁻⁴ 49 7 is day

slide-11
SLIDE 11

RODOS FDMH and myfdmh (wheat, potato)

* fac1 correction for fractionation and nonexchangeable * fac2 conversion from CO2 to H2O assimilation rate * cut cuting day calculation * ratenight night production rate data fac1/0.6/,fac2/0.41/,cut/1.e-7/,ratenight/ 2.4e-3/ * night production * assumption * 2 weeks after anthesis the rate is 5 times less full sun, it decreases after as LAI (because is linked with basal metabolism) * preliminary rate 0.2 * 0.012 kg CO2/m2h cdandec2000 decrease 2 times OBTprod = fac1*fac2*ratenight*(lai/maxlai)*tim*chtomean OBTprod =OBTprod*0.5 Cx= OBTprod*PFx/Yx PF partition factor Y yield

AECL

l TFWT n s s l f f OBT

C t t M D f A M t C 6 . ) ( =

where Mf is the fresh mass of all sinks on one plant, Al is the total leaf area of one plant (dm2), fs is the fraction of hydrolysed starch transferred from leaf to sink, D is the isotopic discrimination factor and Ms is the mass of starch stored in the leaves each day (kg dm-2 leaf area)

slide-12
SLIDE 12

Plant OBT Raskob

leaf OBT trans 1 (fast) trans 2 (slow) grain O BT leaf TW T grain TW T

  • 1. part of net photos.

+ basic m etabolism + m aintenance respiration

  • 2. part of net

photosynthesis basic m etabolism gross photo- synthesis photo- respiration m aintenance respiration

Flow chart of the leaf, assuming uptake of tritium from the atmosphere