
SLIDE 1
www.kit.edu
KIT – die Kooperation von Forschungszentrum Karlsruhe GmbH und Universität Karlsruhe (TH)
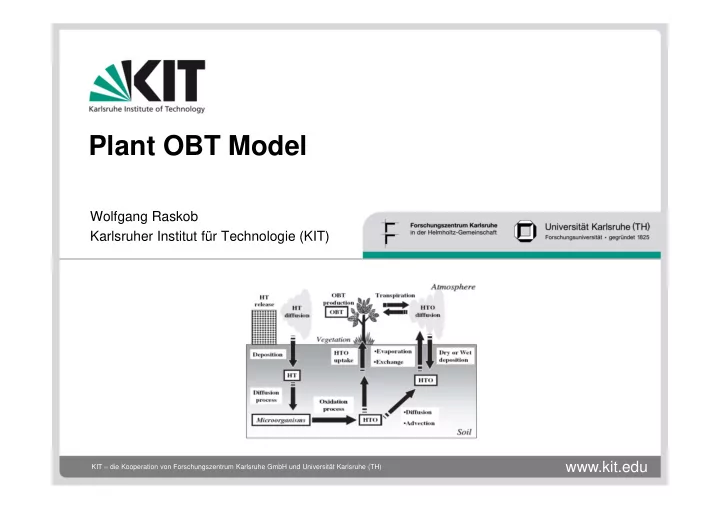
Plant OBT Model
Wolfgang Raskob Karlsruher Institut für Technologie (KIT)
Plant OBT Model Wolfgang Raskob Karlsruher Institut fr Technologie - - PowerPoint PPT Presentation
Plant OBT Model Wolfgang Raskob Karlsruher Institut fr Technologie (KIT) www.kit.edu KIT die Kooperation von Forschungszentrum Karlsruhe GmbH und Universitt Karlsruhe (TH) Objectives of Plant OBT A physically based approach,
www.kit.edu
KIT – die Kooperation von Forschungszentrum Karlsruhe GmbH und Universität Karlsruhe (TH)
Wolfgang Raskob Karlsruher Institut für Technologie (KIT)
Tritium modelling overview
Karlsruhe Institute of Technology (KIT-IKET)
25.01.2011 2
high air concentrations at night, rather low at daytime uptake at night might be important (rate of tritium intake into the plant is only by a factor of about 4-5 lower compared to daytime values, results from wheat exposure experiments performed at FZK)
Tritium modelling overview
Karlsruhe Institute of Technology (KIT-IKET)
25.01.2011 3
ear OBT ear TWT HTO atmosphere ear TRANS leaf OBT grain OBT leaf TWT leaf TRANS stem OBT stem TWT stem TRANS grain TWT
Tritium modelling overview
Karlsruhe Institute of Technology (KIT-IKET)
25.01.2011 4
photosynthesis photorespiration
maintenance respiration basic metabolism
stem leaves ears (+ grains)
stem: 10% leaves: 60% ears: 30%
Tritium modelling overview
Karlsruhe Institute of Technology (KIT-IKET)
25.01.2011 5
Tritium modelling overview
Karlsruhe Institute of Technology (KIT-IKET)
25.01.2011 6
Tritium modelling overview
Karlsruhe Institute of Technology (KIT-IKET)
25.01.2011 7
TRIMOVS (2) TRIMOVS (1) TRICAROM ETMOD UFOTRI-AECL UFOTRI STAR H-3 (2) STAR H-3 (1) Plant-OBT
deviation from observation TRIMOVS (2) TRIMOVS (1) TRICAROM ETMOD UFOTRI-AECL UFOTRI STAR H-3 (2) STAR H-3 (1) Plant-OBT 'Day' exposure: TWT and OBT TWT OBT 2 3
5 54 1 2 3 4
models excluding OBT formation during the night
lower higher 2.1
1.7 1.1 1.2 1.1 1.1 1.1 1.1
5
TWT in leaves after exposure, OBT at harvest
Tritium modelling overview
Karlsruhe Institute of Technology (KIT-IKET)
25.01.2011 8
TRIMOVS (2) TRIMOVS (1) TRICAROM ETMOD UFOTRI-AECL UFOTRI STAR H-3 (2) STAR H-3 (1) Plant-OBT
deviation from observation TRIMOVS (2) TRIMOVS (1) TRICAROM ETMOD UFOTRI-AECL UFOTRI STAR H-3 (2) STAR H-3 (1) Plant-OBT 'Night' exposure: TWT and OBT TWT OBT
models excluding OBT formation during the night
1 2 3 4 5 2 3 4 higher lower
>-100
1.4 1.0
TWT in leaves after exposure, OBT at harvest
Tritium modelling overview
Karlsruhe Institute of Technology (KIT-IKET)
25.01.2011 9
0,0 0,1 0,2 0,3 0,4 0,5 0,6 0,7 0,8 0,9 1,0 6 8 10 12 14 16 18 20 22 24
Time of day (h) at the beginning of exposure %
grain OBTmes grain OBT mod polynomial fit
mean 0.23 %
Tritium modelling overview
Karlsruhe Institute of Technology (KIT-IKET)
25.01.2011 10