
SLIDE 1
1
Medicare Bundled Payment: Risks, Opportunities & Future Implications
Robert Mechanic, MBA The Estes Park Institute February 10, 2015
Overview
- Primer on Medicare bundled payment
- Early experiences and emerging trends
- Opportunities for improved efficiency
- Managing financial risk
- Selecting bundles
- Perspectives and discussion
Brandeis University
2
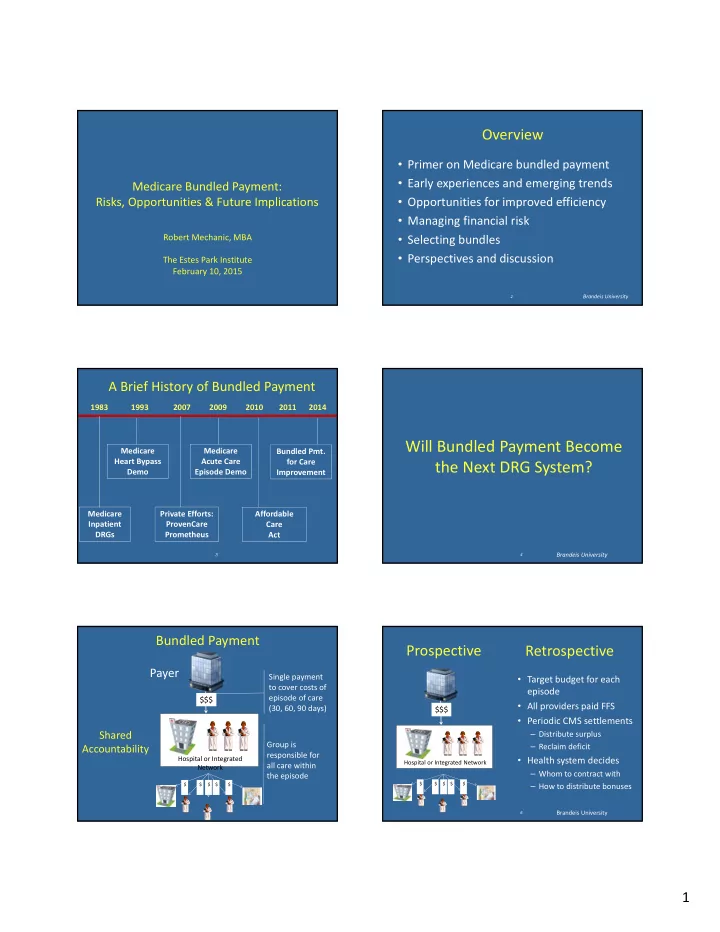
Medicare Inpatient DRGs Private Efforts: ProvenCare Prometheus Medicare Acute Care Episode Demo Affordable Care Act 1983 2007 2011 1993 2009 2010 Medicare Heart Bypass Demo Bundled Pmt. for Care Improvement
3
A Brief History of Bundled Payment
2014
Will Bundled Payment Become the Next DRG System?
Brandeis University
4
Bundled Payment
Hospital or Integrated Network
$$$ Single payment to cover costs of episode of care (30, 60, 90 days)
Payer
$ $ $ $ $
Group is responsible for all care within the episode
Shared Accountability
Prospective
- Target budget for each
episode
- All providers paid FFS
- Periodic CMS settlements
– Distribute surplus – Reclaim deficit
- Health system decides
– Whom to contract with – How to distribute bonuses
Brandeis University
6
Hospital or Integrated Network
$$$
$ $ $ $ $