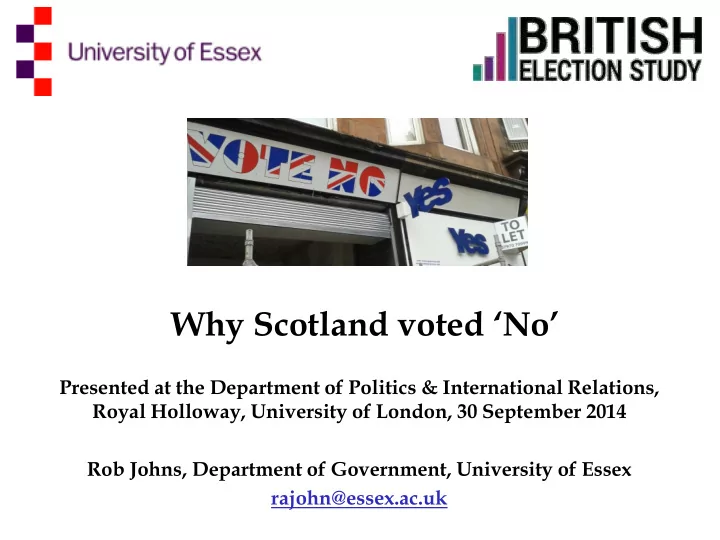

Why Scotland voted ‘No’ Presented at the Department of Politics & International Relations, Royal Holloway, University of London, 30 September 2014 Rob Johns, Department of Government, University of Essex rajohn@essex.ac.uk
The key background 50 Support SNP (list) 40 Support independence % of voters/respondents 30 20 10 0 1999 2003 2007 2011
Boredom, then excitement
Data sources • Two waves of a multi-wave panel survey • Conducted over the internet via YouGov • British Election Study Wave 2 – June 2014 • SRS pre-referendum wave – Rolling cross-section in four one-week batches – 22 August-17 September 2014 • N ≈ 5,000
Why a big lead for ‘No’? • Not a matter of identity
Scottish > British identity 60 British 50 Scottish % of respondents 40 30 20 10 0 Not at all 2 3 4 5 6 Very strongly Self-reported national identities
Why a big lead for ‘No’? • Not a matter of identity • Not a preference for multi-level governance
Where powers should lie Energy Welfare benefits Pensions Tax levels UK Immigration Scottish Defence & foreign affairs 0 10 20 30 40 50 60 70 80 % opting for UK/Scottish Parliament
Stage 1: why a big lead for ‘No’? • Not a matter of identity • Not a preference for multi-level governance • Not widespread optimism about the Union
Consequences of remaining in Union Likely Unlikely (%) (%) UK government would cut spending 49 28 available for Scottish public services Gap between rich and poor would get 57 14 wider Westminster will transfer substantially 33 41 more powers to the Scottish Parliament The UK will vote in a referendum to leave 53 19 the European Union Trident submarines would remain based 79 7 at Faslane on the Clyde Welfare benefits will go down 54 14
Stage 1: why a big lead for ‘No’? • Not a matter of identity • Not a preference for multi-level governance • Not widespread optimism about the Union • Not widespread pessimism about independence
Consequences of independence Likely Unlikely (%) (%) The general economic situation in Scotland 41 38 would be worse Scotland would keep using the pound 56 26 Scotland would retain membership of the 41 39 EU on similar terms Scotland would have a weaker voice in the 47 35 world There would be passport and border 25 57 controls between Scotland and England Scotland and the UK would arrange 48 25 defence cooperation I personally would be better off 23 42
Stage 1: why a big lead for ‘No’? • Not a matter of identity • Not a preference for multi-level governance • Not widespread optimism about the Union • Not widespread pessimism about independence • So what, then? • Fear, risk, uncertainty – independence as an existential threat • And how much people have to lose…
‘Yes’ voting by risk -willingness 100% 80% es' ote 'Yes 60% o vot ing to 40% Intendin In 20% 0% Not at 1 2 3 4 5 6 7 8 9 Very all How willi illing to o tak ake ris risks?
‘Yes’ voting by openness to experience 60 ote 'Yes' 40 o vot ing to % intendin 20 0 Least open 2 3 Most open
Q1: On a scale from 1 (“doesn’t bother me”) to 10 (“utterly terrified”), what number best describes your reaction to that photo? Q2: Should Scotland be an independent country? 1 2 3 4 5 6 7 8 9 10 Yes No
Would you like £10? Or would you prefer to toss a coin… You win nothing You win £25
Now, you have to give me £10 Or we can toss a coin… You give me nothing You give me £25
Voting by council area
Deprivation and ‘Yes’ voting
Age Age squared Socio- Female economic Born rUK drivers of Lived rUK vote choice Degree Protestant Catholic Income lowest 1/4 Income highest 1/4 Owner-occupier Social renter Fear unemployment -0.10 -0.06 -0.02 0.02 0.06 0.10 Effect on probability of Yes vote of 1 s.d. increase in predictor
Why the new voters made little difference 60 ote 'Yes' 40 o vot ing to % intendin 20 0 16-29 30-39 40-49 50-59 60-69 70+ Age e grou oup
General economic situation worse Keep using the pound What drove Retain EU membership decisions? Weaker voice in world Narrower gap between rich and poor Personally better off UK government cut public services Wider gap between rich and poor Substantially more devolution UK votes to leave EU Welfare benefits to be cut -0.4 -0.2 0.0 0.2 0.4 Effect on probability of Yes of 1 s.d. increase in predictor
Late dynamics: in general
Late dynamics: in expectations after a Yes 70 General economy worse Keep using the pound Greater equality Personally better off 60 % 'very' or 'fairly' likely 50 40 30 20 10 0 June 4 weeks 3 weeks 2 weeks 1 week
Late dynamics: in expectations after a No 70 60 % 'very' or 'fairly' likely 50 UK govt cut public services 40 Substantially more devolution 30 20 10 0 June 4 weeks 3 weeks 2 weeks 1 week
Conclusions • Identity provided core support for both camps • But economic risk decided the outcome • The median voter: – Feels more Scottish than British – Wants almost all powers at Scottish level – Questions legitimacy of Westminster government – Optimistic about independence but economic doubts • ‘No’ campaign didn’t change what Scots want; just scared them out of going for it • So is that really it for a generation…?
Why Scotland voted ‘No’ Presented at the Department of Politics & International Relations, Royal Holloway, University of London, September 2014 Rob Johns, Department of Government, University of Essex rajohn@essex.ac.uk
Recommend
More recommend