why initial conditions
play

Why Initial Conditions? Many calculations of collapse Initial - PDF document

Why Initial Conditions? Many calculations of collapse Initial Conditions for Star Formation Depend on initial conditions Relevant Initial Conditions Density distribution: n(r) Neal J. Evans II Velocity turbulence


  1. Why Initial Conditions? � Many calculations of collapse Initial Conditions for Star Formation � Depend on initial conditions � Relevant Initial Conditions � Density distribution: n(r) Neal J. Evans II � Velocity � turbulence � rotation � Magnetic field (subcritical or not?) � Ionization ( if subcritical, t AD ~ x e ) Focus on Density Low Mass vs. High Mass � Larson-Penston � Low Mass star formation � Uniform density � “Isolated” (time to form < time to interact) � fast collapse, high accretion rate � Low turbulence (less than thermal support) � Shu � Nearby (~ 100 pc) � Singular isothermal sphere n(r) ~ r –2 � High Mass star formation � slow infall, low, constant accretion rate � “Clustered” (time to form > time to interact) � Foster and Chevalier � Turbulence >> thermal � Bonner-Ebert sphere � More distant (>400 pc) � initial fast collapse (LP), relaxes toward Shu Even “Isolated” SF Clusters 
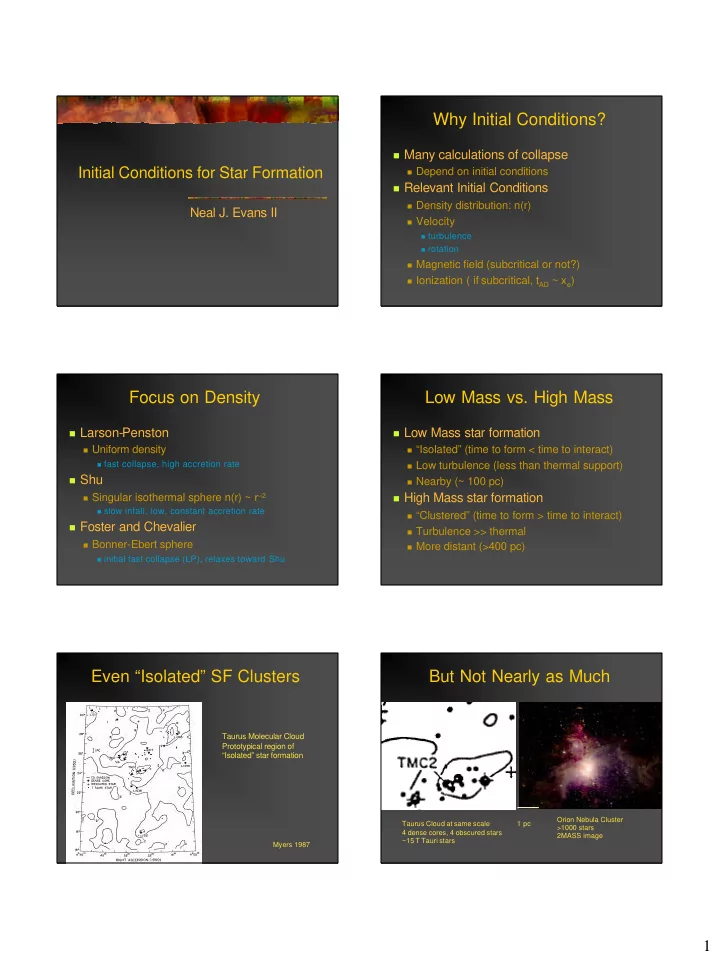
But Not Nearly as Much Taurus Molecular Cloud Prototypical region of “Isolated” star formation Orion Nebula Cluster Taurus Cloud at same scale 1 pc >1000 stars 4 dense cores, 4 obscured stars 2MASS image ~15 T Tauri stars Myers 1987 1

  2. Low Mass Initial Conditions SCUBA Map of PPC � Molecular line maps: denser cores � n > 10 4 cm – 3 � IRAS: some not seen (starless cores) � Submm dust emission from some starless � Pre-protostellar cores (PPCs) � ISO: detected FIR, but not point like � Consistent with heating by ISRF � SCUBA: submm maps made “easy” 850 micron map of L1544 Radial Profile, from azimuthal average A PPC in Taurus � Study n(r) Shirley et al. 2000 Results of Modeling Results of Dust Modeling � Centrally peaked density Density: Bonnor-Ebert n c = 10 6 cm � Bonnor-Ebert sphere is a good model –3 � Central density reaches 10 6 cm –3 Dust temp. Calculated for n(r) � May approach singular isothermal sphere Heated by ISRF � Dust temperature very low toward center Drops to 7K inside � Down to about 7 K Fits radial profiles and SED well. � Affects emission � Some cores denser than others Evans 2001 � Evolutionary sequence of PPCs? Molecular Line Studies The PPC is Invisible to Some � Study of PPCs with dust emission models � Maps of species to probe specific things � C 18 O, C 17 O, HCO + , H 13 CO + , DCO + , N 2 H + , CCS Cut in RA: Convert to N(H 2 ) with standard assumptions C 18 O does not peak Color: 850 micron dust continuum C 17 O slight peak Contours: C 18 O emission Optical Depth plus depletion 2

  3. Others See It Evidence for Infall Motions Line profiles of HCO + Double peaked, Green: 850 mic. Blue peak stronger Red: N 2 H + Signature of inward traces PPC motion. Agrees with Red: Model with predictions of simple dynamics, chemical models depletion model fits the data. Nitrogen based and ions less depleted. Lee et al. 2002 Lee et al. 2002 Results for Low Mass Not Quite Initial… � Dust traces density � Once central source forms, self-luminous � Must account for temperature � Class 0 evolving to Class I � Bonnor-Ebert spheres fit well � Similar studies of dust emission show � High central densities imply unstable � Power laws fit well: n(r) = n f (r) (r/r f ) -p � Cold, dense interior causes heavy depletion � Aspherical sources have lower p � Molecular emission affected by � Most rather spherical � Opacity, depletion, low temperature � For those, <p> ~1.8 � Evidence of inward motions � Before central source forms Distributions of p Studies of High Mass Regions � Survey of water masers for CS Cores with p<1.5 � Early, but not initial are quite aspherical � Plume et al. (1991, 1997) Spherical cores � Dense: <log n> = 5.9 have p in narrow range. � Maps of 51 at 350 micron dust emission <p> = 1.8 +/–0.2 � Mueller et al. 2002, Poster 71.02 � Maps of 63 in CS J = 5–4 emission � Shirley et al. 2002 � Maps of 24 in CS J=7–6 emission Shirley et al. 2002 � Knez et al. 2002 Young et al. 2002 3

  4. Example of Maps Modeling the Dust Emission CS J=5–4 CS J=7–6 350 micron Dust Int. Intensity Int. Intensity 4 sigma contours 4 sigma contours 4 sigma contours M8E M8E Model: Best fit to SED, radial profile Mueller et al. 2002 Distribution of p, n f Luminosity versus Mass Log Luminosity vs. Log M Distributions of p (Shape of density dist.) red line: masses of dense are similar cores from dust Log L = 1.9 + log M Fiducial density is higher by 70–230 for blue line: masses of GMCs massive regions. from CO Log L = 0.6 + log M n f is density at 1000 AU Mueller et al. (2002) Mueller et al. (2002) Results from Dust Models Virial Mass vs. Mass from Dust � Power laws fit well Virial Mass from CS � <p> ~ 1.8 (~ same as for low mass) vs. Mass from Dust � Denser (n f 1–2 orders of magnitude higher) Correlate well � Luminosity correlates well with core mass Good agreement <M v / M d > = 2.4+/–1.4 � Less scatter than for GMCs as a whole Dust opacities � L/M much higher than for GMCs as a whole about right (to factor of 2) � Using DUST mass (as in some high-z work) dust ~ 1.4 x 10 4 L sun /M � L/M sun ~ high-z starbursts � Starburst: all gas like dense cores? Shirley et al. 2002 4

  5. Cumulative Mass Function Linewidth versus Size For logM>2.5 Power law Slope ~ 1.1 (Lower masses incomplete) Clouds: 0.5 Stars: ~1.35 Shirley et al. 2002 Shirley et al. 2002 Results from Molecular Studies INITIAL Conditions: Speculation � Virial mass correlates with mass from dust � Based on sample from maser study � Massive: <M> ~ 2000 M sun from dust � Mass distribution closer to stars than GMCs � Dense � Much more turbulent � Tending toward power law density, p ~ 1.8 � than low mass cores � Turbulent? (assume virial) � than usual relations would predict � But COLD (heated only by ISRF) � No clear examples known Predicted SED High vs. Low Initial Conditions Condition Low High Observed? yes no n(r) Bonnor-Ebert ?? 5

  6. High vs. Low Early Conditions Summary of Results Property Low High � Low mass stars form in � Cold regions (T<10 K) p ~1.8 ~1.8 � Low turbulence � Bonnor-Ebert spheres good models n f (median) 2 x 10 5 1.5 x 10 7 � Power laws after central source forms � High Mass stars Linewidth 0.37 5.8 � Much more massive, turbulent � Power law envelopes, similar p to low mass � But much denser Acknowledgments The Future is Bright Plus, � NASA, NSF, State of Texas NGST, SMA, � Students CARMA, SOFIA � Chad Young (11.04) eVLA, SKA, � Jeong-Eun Lee (71.17) … � Kaisa Mueller (71.02) � Yancy Shirley SIRTF � Claudia Knez ALMA Herschel 6

Download Presentation
Download Policy: The content available on the website is offered to you 'AS IS' for your personal information and use only. It cannot be commercialized, licensed, or distributed on other websites without prior consent from the author. To download a presentation, simply click this link. If you encounter any difficulties during the download process, it's possible that the publisher has removed the file from their server.

Recommend


More recommend