who are the dual eligibles
play

Who Are the Dual Eligibles Dual eligibles are Medicare - PDF document

Figure 1 Who Are the Dual Eligibles Dual eligibles are Medicare beneficiaries who are also enrolled in Medicaid Full dual eligibles Medicare serves as primary payor of their health care Medicaid serves as


  1. Figure 1 Who Are the “Dual Eligibles” • “Dual eligibles” are Medicare beneficiaries who are also enrolled in Medicaid – “Full” dual eligibles • Medicare serves as primary payor of their health care • Medicaid serves as secondary payor, providing services not covered by Medicare (e.g., Rx and LTC) • Medicaid also pays Medicare premiums and cost-sharing – “Partial” dual eligibles receive assistance only with Medicare premium and, in some cases, cost-sharing obligations • To qualify for full Medicaid under federal minimum standards, Medicare beneficiaries generally must have income < 74% poverty and assets < $2,000 (SSI requirements) • States can expand Medicaid coverage for seniors and disabled people beyond federal minimum levels K A I S E R C O M M I S S I O N O N Medicaid and th edicaid and the Uninsured e Uninsured Figure 2 
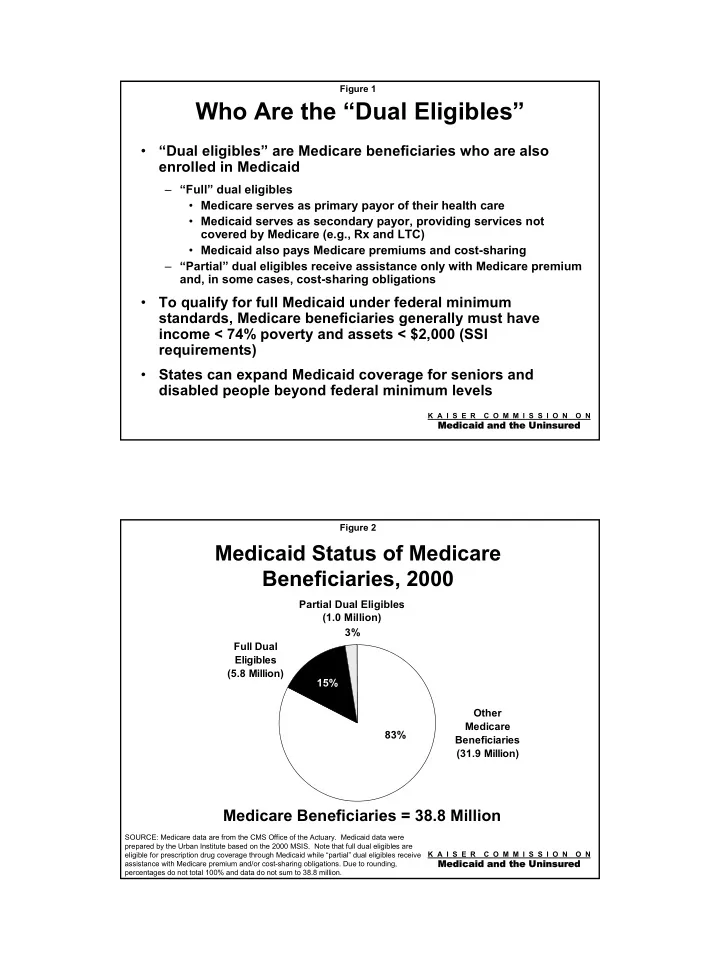
Medicaid Status of Medicare Beneficiaries, 2000 Partial Dual Eligibles (1.0 Million) 3% Full Dual Eligibles (5.8 Million) 15% Other Medicare 83% Beneficiaries (31.9 Million) Medicare Beneficiaries = 38.8 Million SOURCE: Medicare data are from the CMS Office of the Actuary. Medicaid data were prepared by the Urban Institute based on the 2000 MSIS. Note that full dual eligibles are K A I S E R C O M M I S S I O N O N eligible for prescription drug coverage through Medicaid while “partial” dual eligibles receive Medicaid and th edicaid and the Uninsured e Uninsured assistance with Medicare premium and/or cost-sharing obligations. Due to rounding, percentages do not total 100% and data do not sum to 38.8 million.

  2. Figure 3 Characteristics of Dual Enrollees Compared to Other Medicare Beneficiaries, 2000 52% Fair/Poor Health Status 24% 71% Income Below $10,000 13% Dual Enrollees (Medicare Beneficiaries with Medicaid) Other Medicare Beneficiaries 22% Reside in LTC Facility 2% K A I S E R C O M M I S S I O N O N Medicaid and th edicaid and the Uninsured e Uninsured SOURCE: KCMU estimates based on analysis of MCBS Cost & Use 2000. Figure 4 Spending on Dual Eligibles as a Share of Medicaid Spending on Benefits, FFY2002 Non-Rx Spending for Dual Eligibles ($82.7 Billion) 36% Spending on Other Groups 59% ($136.7 Billion) 6% 6% Rx Spending for Dual Eligibles ($13.4 Billion) Total Spending on Benefits = $232.8 Billion Note: Due to rounding, percentages do not total 100%. K A I S E R C O M M I S S I O N O N Medicaid and th edicaid and the Uninsured e Uninsured SOURCE: Urban Institute estimates prepared for KCMU based on an analysis of 2000 MSIS data and Form 64 FY2002 data.

  3. Figure 5 Total Medicaid Spending on Prescription Drugs, 2000 Drug Drug Spending Spending 49% 51% on Dual on Other Eligibles Groups Total Spending = $19.2 Billion SOURCE: Preliminary Urban Institute estimates prepared for KCMU K A I S E R C O M M I S S I O N O N Medicaid and th edicaid and the Uninsured e Uninsured based on MSIS data for FFY2000. Data reflect expenditures on outpatient prescription drugs only and are net of Medicaid rebates. Figure 6 Recent Action by States to Reduce Growth in Medicaid Prescription Drug Spending, 2003-2004 38 37 31 27 26 8 8 Reduced Prior Preferred New or Higher Supplemental Limit Number Require Use of Reimbursement Authorization Drug List Copays Rebates of Drugs Generics for Prescriptions per Month Note: Data reflect the number of states adopting new strategies (or expanding their use of existing strategies) for fiscal year 2003 or 2004 budgets. K A I S E R C O M M I S S I O N O N SOURCE: KCMU survey of Medicaid officials in 50 states and DC conducted by Health Medicaid and th edicaid and the Uninsured e Uninsured Management Associates, June and December 2002 and forthcoming September 2003.

  4. Figure 7 Treatment of Medicaid Beneficiaries in Medicare Bills Senate Bill House Bill Medicaid � “Full” dual eligibles (i.e., those with � All Medicaid beneficiaries are full Medicaid coverage that includes Beneficiaries’ eligible for Part D prescription drugs) are ineligible for Eligibility for Part � Medicare becomes the primary Part D D payor for Rx coverage for dual � “Partial” dual eligibles and Medicare eligibles beneficiaries with Rx coverage under � Medicaid serves as the secondary Medicaid drug-only waivers are eligible payor, supplementing Part D for Part D coverage for low-income individuals as needed to raise it to state Medicaid standards Coordination � No provision for coordination � The Medicare Administrator will implement a plan to coordinate between Medicare between Medicaid and Medicare Medicare and Medicaid drug coverage and Medicaid prescription drug benefit K A I S E R C O M M I S S I O N O N Medicaid and th edicaid and the Uninsured e Uninsured Figure 8 Implications for Dual Eligibles • Senate – No access to Part D prescription drug benefits – Quality of Rx coverage will depend on Medicaid program of state in which dual eligible resides; many states increasingly cutting their Medicaid prescription drug benefit – May lose Medicaid coverage if states scale back optional expansions for seniors and the disabled to shift Rx costs from Medicaid to Medicare • House – Eligible for Part D benefit that is universally available to all Medicare beneficiaries – May secure better coverage through Medicare Part D with Medicaid “wrap around” than under Medicaid alone K A I S E R C O M M I S S I O N O N Medicaid and th edicaid and the Uninsured e Uninsured

  5. Figure 9 Key Provisions Related to States in Medicare Bills Senate Bill House Bill State Fiscal Relief � No Medicare coverage of Rx � Medicare pays for Part D prescription From Rx Benefit benefits for dual eligibles drug benefits for dual eligibles (including low-income subsidies, as appropriate) � Instead, 100% FMAP for Part B premiums for selected dual eligibles � Federal government “recaptures” in states with drug coverage meeting some of the fiscal relief, with the share minimum standards. declining each year until 2020 when states retain all fiscal relief Incentives for � In states that maintain optional � No provision States to Maintain expansions for dual eligibles, 100% Optional FMAP for Medicare Part A deductible Expansions and coinsurance costs Responsibility for � States must determine eligibility for � States must determine eligibility for the Administering the low-income subsidy program. low-income subsidy program. Low-income � Enhanced matching funds provided � Enhanced matching funds provided Subsidy CBO Estimate of � Net of $20 billion � Net of $44 billion Net State Fiscal Relief, 2004 - 2013 K A I S E R C O M M I S S I O N O N Medicaid and th edicaid and the Uninsured e Uninsured Figure 10 Key Differences in the House and Senate Low-Income Subsidy Programs Senate Bill House Bill Eligibility Rules � Cost-sharing and premium � Cost-sharing and premium assistance for Part D assistance for those with income beneficiaries below 160% of below 135% of poverty FPL (3 tiers of subsidy) � Premium assistance for those � No asset test to qualify for between 135% and 160% of FPL lowest tier of subsidy, but must � Must meet an asset test to qualify meet an asset test to qualify for for any assistance higher tiers Level of cost- � Substantial help provided � Substantial help provided until sharing with all drug expenditures, drug costs reach an initial limit of assistance including expenditures above $2,000 the initial limit of $4,500 (i.e., � No help with cost-sharing above there is no “donut hole” for low- $2,000 until out-of-pocket expenses income beneficiaries) reach $3,500 K A I S E R C O M M I S S I O N O N Medicaid and th edicaid and the Uninsured e Uninsured

  6. Figure 11 Estimated Enrollment of Medicare Beneficiaries in House v. Senate Low-Income Subsidy Program, 2013 In millions Total 9.5 Dual Eligibles Total 5.0 7.0 Low-Income Individuals Low-Income 5.0 Individuals 2.5 House Senate K A I S E R C O M M I S S I O N O N Medicaid and th edicaid and the Uninsured e Uninsured SOURCE: CBO cost estimate of H.R. 1 and S. 1, July 22, 2003. All estimates are approximate. Figure 12 Out-of-Pocket Drug Costs for a Medicare Beneficiary Not on Medicaid with Income Below 100% of Poverty, House v. Senate Low-Income Subsidy Programs Out-of-Pocket Costs Catastrophic Limit $4,000 House (if asset test is met) $3,000 $2,000 Initial Limit Initial Limit ($2,000 in Total Costs) ($4,500 in Total Costs) $1,000 Senate (if asset test is met) $0 $1,000 $2,000 $3,000 $4,000 $5,000 $6,000 $7,000 Total Drug Costs SOURCE: KCMU calculations. For the House bill, out-of-pocket costs for co-payments are assumed to average 5 percent of K A I S E R C O M M I S S I O N O N drug costs up to $2,000. NOTES: In the House bill, Medicare low-income subsidy payments count as “out-of-pocket costs” Medicaid and th edicaid and the Uninsured e Uninsured applied toward the catastrophic limit of $3,500. In this example, the individual reaches the $3,500 catastrophic limit when out- of-pocket payments reach $3,000 because of a $500 low-income subsidy. To qualify for the low-income subsidies presented in this chart, beneficiaries also must meet an asset test.

Download Presentation
Download Policy: The content available on the website is offered to you 'AS IS' for your personal information and use only. It cannot be commercialized, licensed, or distributed on other websites without prior consent from the author. To download a presentation, simply click this link. If you encounter any difficulties during the download process, it's possible that the publisher has removed the file from their server.

Recommend


More recommend