Whether low oil prices put an end to oil indexation in gas? What - - PowerPoint PPT Presentation

whether low oil prices put an
SMART_READER_LITE
LIVE PREVIEW

Whether low oil prices put an end to oil indexation in gas? What - - PowerPoint PPT Presentation

Whether low oil prices put an end to oil indexation in gas? What are alternative ways & means to obtain Maximum Marketable Resource Rent in term gas contracts? (invitation to discussion) Dr. Prof. Andrey A.Konoplyanik, Adviser to


slide-1
SLIDE 1

Whether low oil prices put an end to oil indexation in gas? What are alternative ways & means to obtain Maximum Marketable Resource Rent in term gas contracts? (invitation to discussion)

  • Dr. Prof. Andrey A.Konoplyanik,

Adviser to Director General, Gazprom export LLC, Professor of International Oil & Gas Business, Russian State Gubkin Oil & Gas University

Presentation at the Conference “ENERGETIKA-XXI: Economy, Policy, Ecology”, Saint-Petersburg, 11.11.2015

slide-2
SLIDE 2

Oil

A.Konoplyanik, ENERGETIKA-XXI, SPB, 11.11.2015

slide-3
SLIDE 3

A.Konoplyanik, ENERGETIKA-XXI, SPB, 11.11.2015

Crude oil prices 1861-2014 (US dollars per barrel, world events)

Key periods of organized international petroleum market development (*)

(1) 1928 – 1947 (2) 1947 – 1969/1973 (3) 1973 – 1986 (4) 1986 – early 2000-ies (5) Early 2000-ies – 2014 (?) (6) 2014 (?) & further on (?) 1 2 3 4 5 6?

Jekyll Island meeting, 21-26.11.1910 => FRS, 23.12.1913 (finance)

Paper oil market Physical oil market

Achnacarry Agreement, 17.09.1928 (oil) (*) (acc. to A.Konoplyanik)

Source of original chart: BP

slide-4
SLIDE 4

Such different petroleum crises…

A.Konoplyanik, ENERGETIKA-XXI, SPB, 11.11.2015

Major past oil price falls Stage of

  • rganized oil

market development (*) Which segments oil market consists of (physical oi, paper

  • il)

Origins of oil price falls (which oil market segment the fall came from) 1985 Third Only physical oil market From physical oil market 1998 Fourth Both physical & paper

  • il segments

From paper oil market 2008 Fifth Both physical & paper

  • il segments

From paper oil market (financial by nature) 2014 End-fifth (?) or beginning of sixth (?) Both physical & paper

  • il segments

From physical oil market

(*) acc.to A.Konoplyanik classification. See, f.i.: А.Конопляник. Эволюция контрактной структуры на мировом рынке нефти (с.80-190) – глава 2 в кн.: Бушуев В.В., Конопляник А.А., Миркин Я.М. и др. Цены на нефть: анализ, тенденции, прогноз. – М:, ИД «Энергия», 2013, 344 стр.

slide-5
SLIDE 5

A.Konoplyanik, ENERGETIKA-XXI, SPB, 11.11.2015

Source (original chart): V.Drebentsov. Oil Market Update, October 2015. IMEMO Workshop. – Выступление на семинаре «Низкие мировые цены на нефть и их последствия для экономики и нефтегазового сектора России» в рамках Форума ИМЭМО-BP «Нефтегазовый диалог», ИМЭМО РАН, Москва, 21.10.2015

$65 through next year

No price kick-back foreseen… as it happened in 2009

slide-6
SLIDE 6

Barclays analysts on raw materials markets in their “Upward bound” report: price increase is inevitable, but market still thinks differently…

A.Konoplyanik, ENERGETIKA-XXI, SPB, 11.11.2015

Graphics: Barclays Research Source: http://nangs.org/news/industry/barclays-rost-neftyanykh-tsen-neizbezhen-2846 $65 through 4 years

slide-7
SLIDE 7

The reason of current oil glut = end of primary commodities super-cycle + new type of investment cycle in new marginal/swing oil?

1) End of primary commodities super-cycle: e.g. referred to by:

– E.Nabiulina (continuation of low oil price, Central Bank pessimistic oil price forecast much below 40USD), – M.Zadornov (all commodities, not only oil, will not grow next 4-5Y)

2) US shale revolution = new type of investment cycle in shale oil (new marginal/now second swing producer) compared to traditional oil (ME/SA):

– shorter duration => quicker introduction of innovations => more radical decline of “learning curve”/cost decrease supports competitiveness under falling oil prices – New indicators to consider (f.i. “number of rigs” now less illustrative for production forecast)

A.Konoplyanik, ENERGETIKA-XXI, SPB, 11.11.2015

slide-8
SLIDE 8

A.Konoplyanik, ENERGETIKA-XXI, SPB, 11.11.2015

Source: V.Drebentsov. Oil Market Update, October 2015. IMEMO Workshop. – Выступление на семинаре «Низкие мировые цены на нефть и их последствия для экономики и нефтегазового сектора России» в рамках Форума ИМЭМО-BP «Нефтегазовый диалог», ИМЭМО РАН, Москва, 21.10.2015

slide-9
SLIDE 9

A.Konoplyanik, ENERGETIKA-XXI, SPB, 11.11.2015

Source: V.Drebentsov. Oil Market Update, October 2015. IMEMO Workshop. – Выступление на семинаре «Низкие мировые цены на нефть и их последствия для экономики и нефтегазового сектора России» в рамках Форума ИМЭМО-BP «Нефтегазовый диалог», ИМЭМО РАН, Москва, 21.10.2015

slide-10
SLIDE 10

Shale & traditional oil: key differences of investment cycles

Parameters Shale Traditional Fixed costs (CAPEX) to total costs Low High Variable costs (OPEX) to total costs High Low Economic life-cycle, years Short (2-3) Long (10-15+) Time lag between FID & 1st oil Short (weeks) Long (years) Responsiveness to oil price fluctu- ations (short-term price elasticity) High Low Type of rent extracted Technological rent Natural resource rent (economy of scale) Daily production/well decline High Low How this type of investment cycle influence on price volatility Soften / “shock absorber” (*) (quick invest effect) Intensify (delayed invest effect) Key producers & their financial characteristics Small & medium independents/not robust enough (lack of cash to finance from cash flow, fully dependent of debt financing) Majors/robust (enough cash to finance from cash flow) Financing (project finance is …) Conveyer/standardized (each project deal is typical), easy going Art (each project deal is unique), sophisticated

A.Konoplyanik, ENERGETIKA-XXI, SPB, 11.11.2015

Based , inter alia, on: Spencer Dale (BP Group chief economist). The New Economics of Oil. Society of Business Economists Annual Conference, London, 13 October 2015, p.7; (*) term of S.Dale

slide-11
SLIDE 11

Source: Trace Alloway. Crude slide sparks oil-related debt fears. – “Financial Times”, 22/23.11.2014, p.15 100%

slide-12
SLIDE 12

Gas

A.Konoplyanik, ENERGETIKA-XXI, SPB, 11.11.2015

slide-13
SLIDE 13

Corridor of cut-off prices for producer & consumer

NBRV price = upper investment price (upper long- term limit) Spot/futures price = current short- term price Cost-plus price = lower investment price = (lower long-term limit)

t

USD/bbl, USD/MMBTU Maximum affordable price for consumer (lowest among available alternative options in end-use) Minimum affordable price for producer (the price of self-financing up to delivery point)

slide-14
SLIDE 14

Maximum Marketable Resource Rent (MMRR) & oil indexation: evolution of instruments

  • Sovereign State & non–renewable energy resource:

– International law (UNGA Res.1803/Dec’1962; Art.18 ECT/1994-1998; etc) – “Principal vs Agent” theory => Russian Federation (Principal) vs. Gazprom (its export Agent) => Gazprom to obtain MMRR for its Principal – Groningen-type LTGEC (1962+) = economic & legal background for MMRR in gas => historical tool for Gazprom to obtain MMRR

  • Implementation then (situation differs from now):

– Historical precedent of NBRV in W.Europe in 1950/60-ies in oil (RFO substituted coal in competitive areas) – Gas enters energy market in 1960-ies => No gas-to-gas competition => gas competed

  • nly with other energies => oil (petroleum products/PP)

– NBRV for new investment decisions => oil/PP-indexation as a mean to compete &

  • btain MMRR (PP dominated energy balance) => clear straightforward contractual

structure for long-term in growing market

  • Since then situation in EU gas changed radically:

– Not growing but mature & oversupplied market – Ecologically, economically & politically motivated diversification – New institutional structure of emerging internal EU gas market – Increased multi-facet competition, demand for flexibility to be competitive

  • Whether former oil-indexed LTCs suit best for obtaining MMRR to RF by

Gazprom in these conditions?

A.Konoplyanik, ENERGETIKA-XXI, SPB, 11.11.2015

slide-15
SLIDE 15

Key factors of MMRR formation for Russia (as for sovereign state - owner of non- renewable natural resource - gas) by its export agent (Gazprom state company - sole pipeline gas exporter by law) in gas deliveries to Europe by oil-indexed LTGEC

A.Konoplyanik, ENERGETIKA-XXI, SPB, 11.11.2015

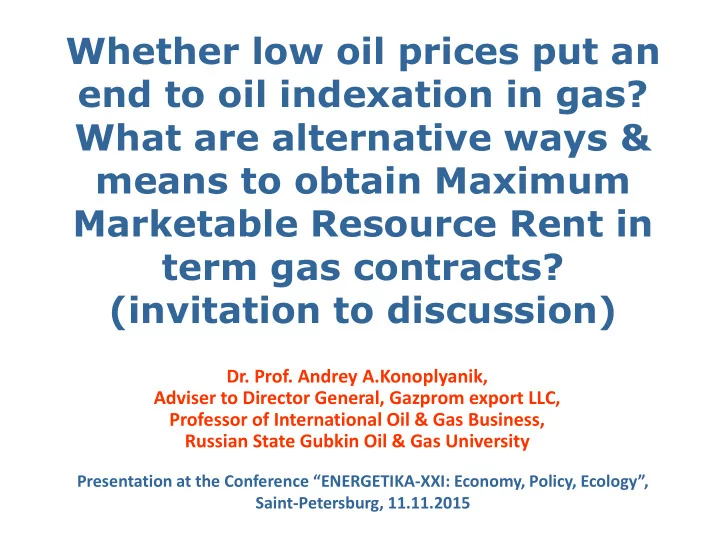
Periods (EU gas market character) Factors providing for MMRR for exporting state Key factor providing for MMRR Physical substitutability of PP & gas in main areas of consumption Oil price level Early 1960-ies to early 1970-ies (seller’s market) Gas enters EU market & competes with PP which dominates in fuel balance Low Physical substitutability of energies in end-use 1970-ies – mid- 1980-ies (seller’s market) Gas continues to compete with PP at EU market & drives them out from fuel balance Violent growth, high, then short-term deep fall (1985) High oil price, LTGEC structure (duration, TOP) 2H/1980-ies – early 2000-ies (seller’s market) PP are mostly driven out of fuel balance but are left as reserve fuel Medium low, unstable, then short-term fall (1998) LTGEC structure (duration, TOP) 2000-ies till 2009 (seller’s market) PP are mostly driven out of fuel balance but are left as reserve fuel Violent growth, then short-term fall (2008) High oil price, LTGEC structure (duration, TOP) but counteraction of the buyers 2009-2014 (buyer’s market) PP are mostly driven out of fuel balance but are left as reserve fuel High, then fall (2014) LTGEC structure (duration, TOP) but increased counteraction of the buyers (*) 2014 & further on (how long?) (buyer’s (?) market) PP are mostly driven out of fuel balance but are left as reserve fuel; gas enters transport sector where it directly competes with PP Preservation of relatively medium-low price in mid-term perspective (?) Denial from domination of PP-indexation (?) in favour of more flexible mechanisms

  • f MMRR collection to protect gas

competitiveness (*) incl. arbitration; gradual softening of PP-indexation by, inter alia, addition of spot component into gas price formula, retroactive pay-backs to buyers to support gas competitiveness

slide-16
SLIDE 16

20 40 60 80 100 120 140 160 180 200 2010201120122013201420152016 20172018201920202021202220232024 202520262027202820292030203120322033 20342035 bcm

Contracted volumes of Russian gas supplies to Europe: what will fill the gap?

Denmark Switzerland Slovak Republic Poland Netherlands Italy Hungary Germany France Finland Czech Republic Austria Turkey Greece

Source of primary chart):ERI RAS (T.Mitrova), reproduced in & taken from «The Russian Gas Matrix: How Markets Are Driving Change», Ed. by J.Henderson & S.Pirani, Oxford University Press, 2014, Fig.3.1/p.53.

Expanding niche for (at least partial?) substitution of terminating EU LTC supplies at the border by spot deliveries & trade at EU hubs; or partial redirection of terminating EU LTC to the East?

New LTC? Spot? Asia?

slide-17
SLIDE 17

What are the options for adaptation?

  • No ways to renew expiring contracts at their previous structure (Third Energy

Package) => low oil price + expiration of current LTC = adaptation is inevitable => what are the options?

  • To sell at the external Russian border? No?

– Informal/indirect proposal from EU/CEC to continue transit through UA either by Gazprom, or EU companies, or (assumed) by new EU Single Purchasing Agency?

  • Motivation: to finance Ukraine by transit of Rus gas. Whether EU companies would agree to

take transit risks? EU SPA = new EU Gosplan/MinVneshTorg?

  • To stay with current LTC but to trade at the hubs at hub-indexed price? No?

– Downgrading price spiral (S.Komlev)

  • To sell at auctions in SPB? Yes, one of partial solutions (testing new options)
  • To use hybrid forms of indexation? Too sophisticated?

– Net-back Replacement value (NBRV) = inter-fuel competition (gas to other energies), instrument of growing/seller’s market; instrument for new CAPEX – In oversupplied mature/buyer’s market NBRV converted to competitive value (+ gas-to-gas competition), instrument for new OPEX – How to index to increasing number of competing energies with increasingly volatile price behavior ?

  • To implement portfolio approach (integrated supply, trading and marketing

model)? To be present both in term & spot segments, to minimize losses under bad market & maximize benefits under good market non-dependent

  • il price fluctuations? “Domino effects” possible benefits …
  • Internal debates continues….

A.Konoplyanik, ENERGETIKA-XXI, SPB, 11.11.2015

slide-18
SLIDE 18

Ukraine: “transit interruption probability” index (2009–2015)

1 2 3 4 5 6 7 8 9 10 12.30.08 2.28.09 4.30.09 6.30.09 8.31.09 10.31.09 12.31.09 2.28.10 4.30.10 6.30.10 8.31.10 10.31.10 12.31.10 2.28.11 4.30.11 6.30.11 8.31.11 10.31.11 12.31.11 2.29.12 4.30.12 6.30.12 8.31.12 10.31.12 12.31.12 2.28.13 4.30.13 6.30.13 8.31.13 10.31.13 12.31.13 2.28.14 4.30.14 6.30.14 8.31.14 10.31.14 12.31.14 2.28.15 4.30.15 6.30.15

Transit interruption probability index Calculated by M.Larionova, Russian Gubkin State Oil & Gas University, Chair “International Oil & Gas Business”, Master’s programme 2013-2015, on methodology, jointly developed with A.Konoplyanik, based on principles of credit ratings evaluation by major international credit agencies

To evaluate possible interruptions of transit supplies we consider 1014 newsbreaks, related to gas relations between Russia and Ukraine through 30.12.2008 to 15.07.2015 period. These newsbreaks were taken from the newswire http://newsukraine.com.ua/ . Then they were filtered to and ranged within 226 newsbreaks which, in case of their realization, would have a main effect on interruption of gas flows in transit within the Ukrainian territory.

slide-19
SLIDE 19

New model for EU: Evolution of gas value chain & pricing mechanism of Russian gas to EU (2)

Gazprom Wholesale EU buyer / reseller (trade & delivery) End-use EU customer Gazprom Wholesale EU buyer / reseller (delivery) End-use EU customers (delivery)

Future (“NO GO” contractual scheme under any (?) supply-demand scenario) Future (what competitive niche for oil-indexed LTC & spot deliveries & trade to/within EU?)

Hub-indexation (no MMMR) Hub-indexation Hub-indexation Indexation (NBRV/MMRR) Common interests – downgrading price spiral for (RUS) gas Common interests

Gazprom as price-taker from GAS BUYER’s market (with no participation on it)? => NO GO

Oil EU hubs (trade)

Gazprom as

  • ne of price-

makers at emerging EU market

Role of DG COMP? Traditional flexibility for buyer (TOP) Direct supplies to EU end-users

UGS

A.Konoplyanik, EUSPB, 02.10.2015

slide-20
SLIDE 20

Russian gas ring diminishes UA transit risk & presents a non-transit way for UA to raise gas revenues (thus covers issue of major EU concern)

Hub in Baumgarten UGS in Western Urkraine Today: GP uses UA UGS for seasonal adjustments of RUS transit flows to EU Post-2019 (no UA transit?): GP to use UGS in Western UA to balance market fluctuations at EU market in the nearest market zones (hub Baumgarten, etc.) => GP shall be present at EU hubs NB: “Russian gas ring” supply concept as a RF & EU safeguard from new transit monopolies + new revenues for UA

?

slide-21
SLIDE 21

Thank you for your attention!

www.konoplyanik.ru andrey@konoplyanik.ru a.konoplyanik@gazpromexport.com

Disclaimer: Views expressed in this presentation do not necessarily reflect (may/should reflect) and/or coincide (may/should be consistent) with official position of Gazprom Group (incl. Gazprom JSC and/or Gazprom export LLC), its stockholders and/or its/their affiliated persons, and are within full personal responsibility of the author of this presentation.