
SLIDE 1
What happens when it rains
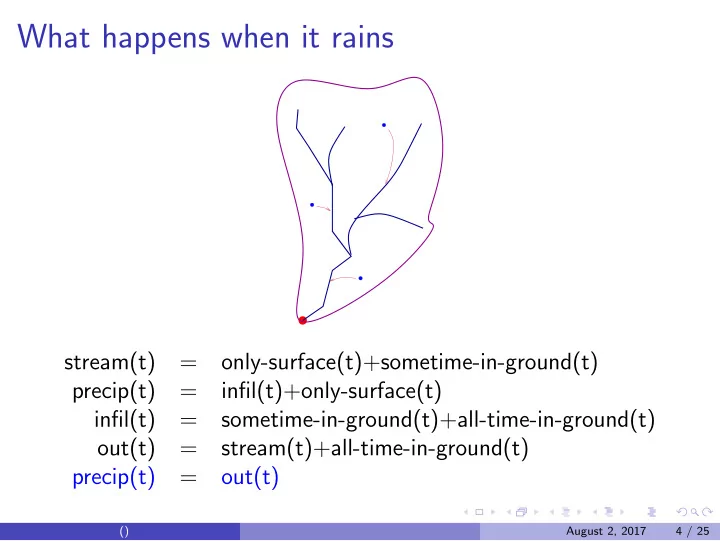
stream(t) =
- nly-surface(t)+sometime-in-ground(t)
precip(t) = infil(t)+only-surface(t) infil(t) = sometime-in-ground(t)+all-time-in-ground(t)
- ut(t)
= stream(t)+all-time-in-ground(t) precip(t) =
- ut(t)
() August 2, 2017 4 / 25