
SLIDE 1
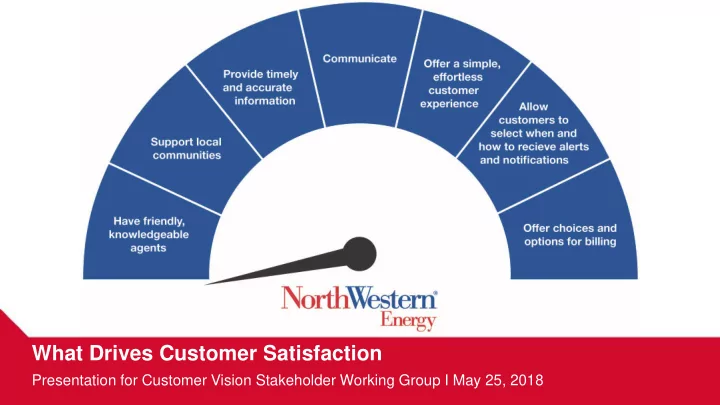
What Drives Customer Satisfaction
Presentation for Customer Vision Stakeholder Working Group I May 25, 2018
What Drives Customer Satisfaction Presentation for Customer Vision - - PowerPoint PPT Presentation
What Drives Customer Satisfaction Presentation for Customer Vision Stakeholder Working Group I May 25, 2018 Meet the team Bobbi Schroeppel VP-Customer Care, Comm & HR What do top-performing companies look like? Source: JD Powers Our
What Drives Customer Satisfaction
Presentation for Customer Vision Stakeholder Working Group I May 25, 2018
Meet the team
Bobbi Schroeppel
VP-Customer Care, Comm & HR
What do top-performing companies look like?
Source: JD Powers
Our Customer Intent Statement
Our Customer Life Cycle
− Butte MT and Huron SD − Staffed 7am – 6pm M-F and 8am – 5pm Saturday − 24/7 Emergency response
− Phone − Email − Web Inquiries and service requests − Walk in interactions
− Customer Requests are routed electronically to our field
resources
− Certain orders auto close when work is completed in the
field
− Less resources to process orders − Leveraged non billing meter reads to close service
requests
Current structure
Customer-focused quality
First contact resolution - phone
82.97% 69.32% 60% 65% 70% 75% 80% 85%
N_W_E 29 Combo Utilities
Source: 2018 JD Power Electric Utility Residential Study through 3rd wave – 29 (combo) electric & gas utilities in the study
point for customers
mind
Customer service walk-in locations
Assistance
Assistance/Low Income
Assistance Customer assistance
Online outage map
Website traffic
2018, vs. calling
− Significantly higher adoption rate compared to our IVR and Online Customer
Care
providing this feature on our map using GPS location
− 13,250 customers visited the outage map (4 min view time) − 147 Street light problems reported through the map − 293 enrollments in outage notifications − 900+ text and email outage communications sent to
customers
Our customers love it!
PQR Index by number of outage information points
NorthWestern Energy 1.92 outage information points recalled
Source: 2018 JD Power Electric Utility Residential Study through 3rd wave – all brands
Channels
− Social Media − Chat (future chatbots) − SMS (texting) − Routed emails − IVR with authentication and predictive analysis Future
− Chatbots with AI − Natural Language Processors
workforce optimization
Future enhancements
to receive
communicate relevant, personalized marketing campaigns
Customer Preference Center
− Paper bill − Paperless − Web Access − Budget Billing − Summary bill
− Mail (42%) − Customer Service Walk-in Locations
(9%)
− Western Union/SpeedPay (18%)
− Text Alerts
− In-house EFT w/Pick a Due Date (16%) − Internet (14%) − Energy Assistance (1%)
Billing & payment options
Customers’ payment preference
30.1% 18.7% 19.1% 19.4% 2.2% 3.1% 4.6% 0.4% 2.2% 21.8% 21.3% 21.1% 23.8% 2.7% 3.8% 2.6% 0.9% 2.0% 0% 5% 10% 15% 20% 25% 30% 35% N_W_E All Brands
Source: 2018 JD Power Electric Utility Residential Study through 3rd wave – all brands
JD Power verbatims – convenience fee
keep track of my spending.”
That means I try to save that money by mailing a check each month. but then I still have to pay postage.”
this day and age so we have to mail a check every month.” (relates to credit/debit card fees)
Question: What, if anything, could be improved with the billing and/or payment process?
− Acquire DSM at cost less than
alternatives through Rebates and Custom Incentives
− All ratepayers benefit − DSM Program participants get
dual benefit
costs and bill reductions from saved energy
− Environmental benefits − Full cost recovery
Energy Efficiency- Demand Side Management (DSM)
−
Bill Discount
−
Energy Share − Free Weatherization
Energy Efficiency- Universal Systems Benefits (USB)
Energy Efficiency: electric program reporting
self-service websites:
− My Energy Account − Real Estate Corner − Community Action Corner
Online Customer Care
Top “My Energy Account” visits
− Charges/Payments
− Update to mailing address,
email and phone number
Recent enhancements…..pay online
What’s coming….ONLINE Landlord Portal
Research before action
20% of our Customers 3% of our Customers 14% of our Customers 20% of our Customers 27% of our Customers 16% of our Customers
Our channel funnel
number of customers on EZ Pay through segmentation
signed up for EZ Pay = 4.53% response rate
Example: Paid Campaign
e-billing and EZ Pay prioritizing efficiency
in e-billing
in EZ Pay Example: Owned
Bill insert Employees Offices Facebook Website
Identify unique
highlight and share our work
Example: Earned
Channel recall
Reported to have seen at least some type of advertising from NorthWestern Energy in the past few months
And finally what impact does it have
Those who recalled seeing some type of ad, had better views of the company:
Supporting our communities
Grants
Volunteerism
A big lift in Corporate Citizenship results when a customer is aware of utility employees volunteering in the community.
2017 JD Power Residential Electric Utility Study results
775 669 640 660 680 700 720 740 760 780 800
Yes No
NWE - Corporate Citizenship - Seen Utility Employees Volunteering
21.5% 78.5%
who has donated at least 20 to 31 hours
qualifying non-profit
have donated 32 hours or more of personal time during a work year to a qualifying non-profit
participates as a team member at a company-sponsored event such as a music festival or a fundraising relay
annually and team grants quarterly
Employee volunteer appreciation grants
Volunteer Activity
endorsed by local Charitable Contribution Committees or Executive Management
endorsed volunteer activity
per year
8 hours
Community service policy
− Boards − Committees − Financial Support
− Upgrade of aging facilities − Brownfield re-development − Matching new business with existing
infrastructure
Economic Development – our role?
Corporate citizenship and community involvement matter to our customers
Corporate giving
Offerings
On the horizon