West River Commons A Mixed-Use Gem 53 Apartment Units 3 - - PDF document

west river commons a mixed use gem
SMART_READER_LITE
LIVE PREVIEW

West River Commons A Mixed-Use Gem 53 Apartment Units 3 - - PDF document

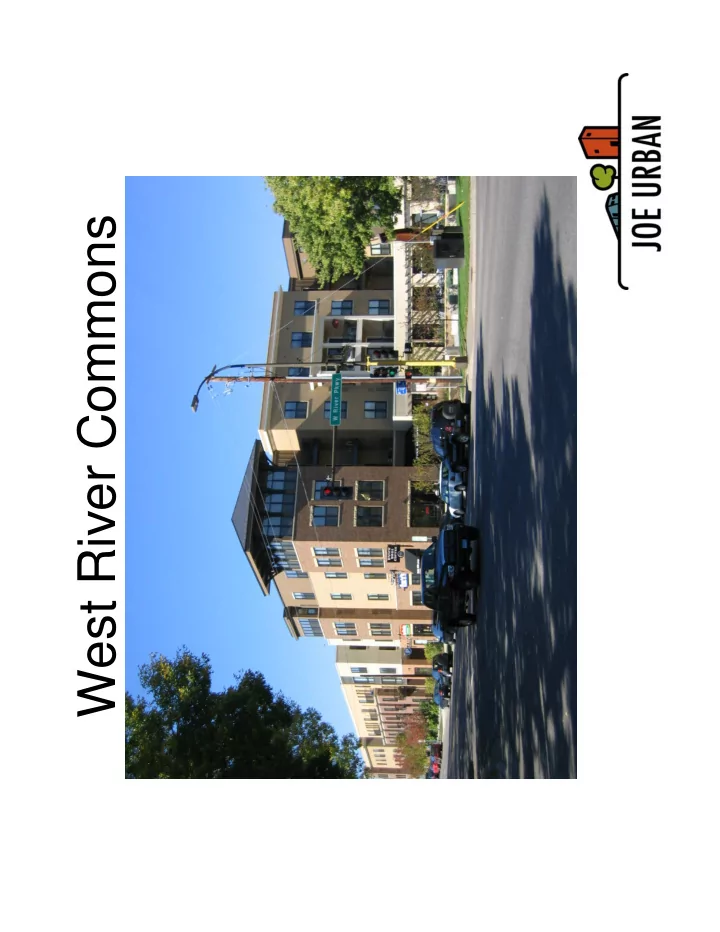
West River Commons A Mixed-Use Gem 53 Apartment Units 3 Townhomes Restaurant Coffee Shop Parking Hidden Public Plaza Planning/Design Elements Iconic Architecture Planning/Design Elements Retail on Lake Street


slide-1
SLIDE 1

West River Commons

slide-2
SLIDE 2

A Mixed-Use Gem

  • 53 Apartment Units
  • 3 Townhomes
  • Restaurant
  • Coffee Shop
  • Parking Hidden
  • Public Plaza
slide-3
SLIDE 3

Planning/Design Elements Iconic Architecture

slide-4
SLIDE 4

Planning/Design Elements Retail on Lake Street

slide-5
SLIDE 5

Planning/Design Elements Housing Above/Stepped Down

slide-6
SLIDE 6

Planning/Design Elements Parking Hidden

slide-7
SLIDE 7

Planning/Design Elements Pedestrian-Friendly

slide-8
SLIDE 8

Site Plan

slide-9
SLIDE 9

Timeline

  • Planning Started – Summer 2000
  • Site purchased – fall 2001
  • Retail market analysis – October 2001
  • Apartment market analysis – May 2002
  • Groundbreaking – August 2002
  • Fire – June 2003
  • Completion – August 2004
slide-10
SLIDE 10

Important Statistics

  • Site Size – 1.1 acres
  • Residential Units – 56
  • Density – 50 units/acre
  • Underground parking – 74 stalls
  • Surface parking – 37 stalls
  • Retail – 7,925 square feet (4.7 per 1,000)
slide-11
SLIDE 11

Site Analysis

  • Strong retail and housing site
  • Nearby river/parks system
  • Lake Street Commercial Corridor
  • Single-Family residential
slide-12
SLIDE 12

Retail Demand

  • Retail Demand

– Demographics – Income Analysis – Retail competition – Demand estimate

slide-13
SLIDE 13

Area Map

  • 2 census tracts

in PMA

  • 6 tracts in SMA
  • Very local-
  • riented trade

area

slide-14
SLIDE 14

Demographics

  • 1990 census, 2001 estimate and 2006

forecast

– Using Claritas Inc. estimates/forecasts

  • Population/household loss overall
  • Growth in age 45-64 cohort

– Empty-nesters, more likely to eat at restaurant

slide-15
SLIDE 15

Retail Inventory

Sit-Down Restaurant Grocery Molly Quinns Norm's Food Market Lake Street Grill El Norteno Market & Deli Dragon City Café Pizza Pie & I Entertainment Video Lease Fast Food El Sonida Latino Taco Bell White Castle Coffee Dairy Queen Riverview Café Blue Moon Auto/Vehicles Arctic Cat dealer Other Auto Mart Leviticus Tattoos SuperAmerica Armstrong's Sports Bar

Restaurant w/Liquor Restaurant w/o Liquor Molly Quinn's Shega Armstrong's Bridgeman's Lalibela Dragon City Café Lake Street Garage Pizza Pie and I

slide-16
SLIDE 16

Restaurant Demand Estimate

2001 2006 Demand Market Area Population 24,449 24,049 (times) Annual Per Capita Expenditures x $1,857 $2,153 (equals) Total Trade Area Expenditures = $45,412,551 $51,784,280 (minus) Approx. Leakage Outside Market Area (50%) 1

  • 50%

50% (equals) Estimated Demand = $22,706,275 $25,892,140 (times) Percent Likely to Eat at Sit-Down Restaurant (25%) x 25% 25% (equals) Estimated Demand = $5,676,569 $6,473,035 (plus) Demand From Outside Market Area (20%) + 20% 20% (equals) Total Estimated Demand = $6,811,883 $7,767,642 Supply Total Neighborhood Restaurant Space in Market Area 14,000 14,000 (times) Average Sales per Square Foot 2 x $225 $264 (equals) Total Estimated Annual Sales in Market Area = $3,150,000 $3,696,000 Net Market Support Excess Demand (Demand minus Supply) = $3,661,883 $4,071,642 Supportable Restaurant Space (divided by) Average Sales per Square Foot 2 $225 $264 Total Addtl. Space Supportable in Market Area (in Sq. Ft.) = 16,275 15,423

1 Leakage is equal to the estimated amount of restaurant dollars spent outside the market area. 2 From Dollars and Cents of Shopping Centers, Urban Land Institute.

Sources: Claritas, Inc. Dollars and Cents of Shopping Centers, Urban Land Institute Maxfield Research Inc. 2001 and 2006 TABLE 5 DEMAND FOR RESTAURANT SPACE LAKE STREET TOTAL MARKET AREA

slide-17
SLIDE 17

Restaurant Conclusions

  • “A high-quality restaurant, with outdoor seating in

summer months, would be successful on the site”

slide-18
SLIDE 18

Coffeehouse Demand Estimate

  • Additional supportable – 2,000+ SF
  • Visibility and traffic counts lend site to

coffeehouse use

  • Several chains (Starbucks & Caribou)
  • perate with lower traffic counts
  • (Also demand for additional +/- 5,000
  • ther retail space on site)
slide-19
SLIDE 19

Project Performance

  • Apartments leased by At Home
  • 30% pre-leased
  • Fully occupied within 6 months
  • Longfellow Grill one of two anchors
  • Dunn Bros is other anchor
  • Overall project very successful
slide-20
SLIDE 20

Questions and Answers