
SLIDE 1
1
Welcome
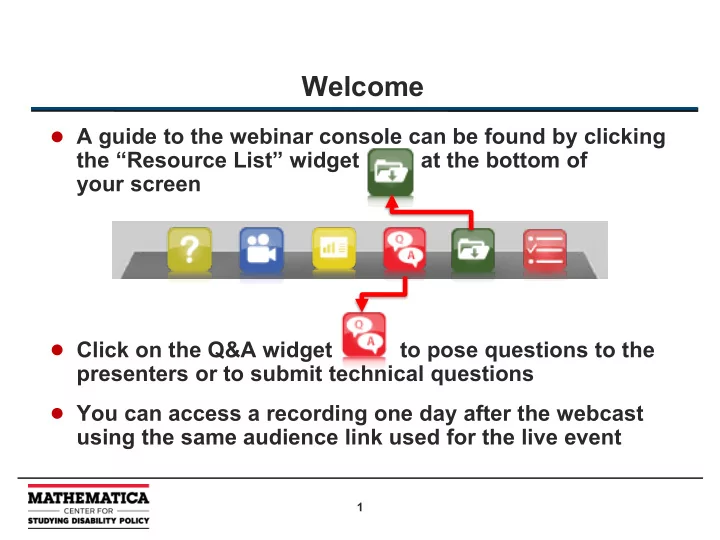
- A guide to the webinar console can be found by clicking
the “Resource List” widget at the bottom of your screen
- Click on the Q&A widget to pose questions to the
presenters or to submit technical questions
- You can access a recording one day after the webcast