WELCOME Community Budget Meeting Tuesday, February 2, 2016 - - PowerPoint PPT Presentation
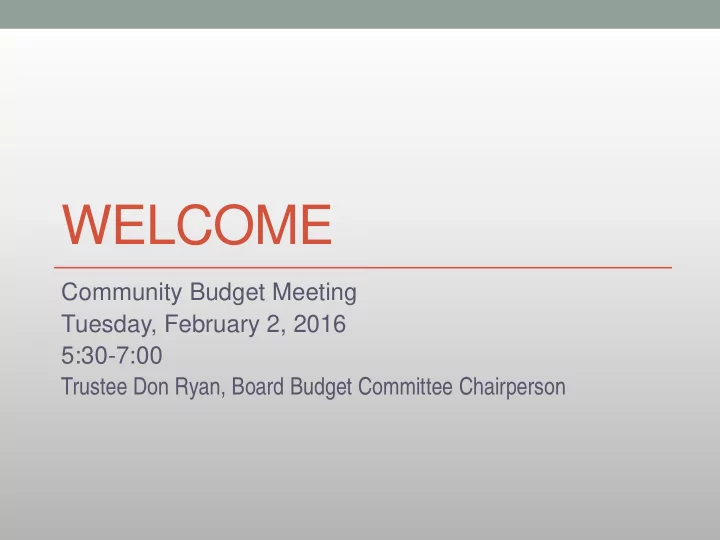
WELCOME Community Budget Meeting Tuesday, February 2, 2016 5:30-7:00 Trustee Don Ryan, Board Budget Committee Chairperson THANK YOU FOR BEING HERE! Please join us for future meetings: Wednesday, February 17, 2016, 5:30-7:00, PGEC: State
THANK YOU FOR BEING HERE! Please join us for future meetings:
Wednesday, February 17, 2016, 5:30-7:00, PGEC:
- State & Federal Revenue Projections
- Estimates of Expenses: Cost Increases & Earmarks
- Thursday, March 3, 2016, 5:30-7:00, PGEC :
- Final Review of State Funding and Expense Estimates
- Community Input on Budget Priorities
- Thursday, March 10, 2016, 5:30-7:00, PGEC :
- Budget Recommendations & Proposal
- Community Input
- Committee Discussion
- Monday, March 28, 2016, Regular Board Meeting, 5:30, DOB:
- Final Budget Recommendation
- Board Action
TONIGHT’S AGENDA
Welcome and Explanation of Community Process Trustee Don Ryan, Board Budget Committee Chairperson Reserve Presentation Audience Questions and/or Comments Brian Patrick, Director of Business Operations Macro Budget Presentations: District Level Budgetary Expenditures Audience Questions and/or Comments K-8 Budgetary Expenditures Audience Questions and/or Comments 9-12 Budgetary Expenditures Audience Questions and/or Comments Technology Budgetary Expenditures Audience Questions and/or Comments Brian Patrick, Director of Business Operations Ruth Uecker, Asst. Supt. K-6 Tom Moore, Asst. Supt. 7-12 Tom Hering, Director of Informational Technology Closing Remarks Trustee Don Ryan, Board Budget Committee Chairperson
Understanding Reserves
Presented by Brian Patrick February 2, 2016 Community Budget Meeting
School Budgeted Funds
General Fund 81.28% Retirement 11.14% Transportation 4.36% Technology 1.48% Adult Education 0.77% Tuition 0.23% Flexibility 0.39% Building Reserve 0.36%
Cascade County Superintendent’s Annual Financial Report
Great Falls Public Schools Ending Cash Balance - June 30th
Elementary
High School Total
- 2015
$26,439,396 $9,785,626 $36,225,022
- 2014
$28,050,579 $9,640,460 $37,691,039
- 2013
$29,509,635 $9,999,456 $39,509,091
- 2012
$29,782,258 $10,056,162 $39,838,420
- 2011
$35,412,324 $11,236,539 $46,648,863
End of Fiscal Year
- School – Governmental Accounting Requirements
–Inventories converted to cash (Technology, Food,
Warehouse)
–Student Funds (Student Council, FFA, etc.) –Cooperative Agreements – Inter-local
Technology Account
–Encumbrances – money held to pay for an item
that has been ordered, but has not arrived
–Scholarship Funds – Endowment funds that are
designated to only spend the interest generated
What are “Reserves”?
(or ending Fund Balances)
- A variety of funds or accounts that are outside
the General Fund.
- GFPS has 18 specific funds. (One less next year)
18 Major District Funds:
1.Transportation 2.Retirement 3.Adult Education 4.Technology 5.Flexibility 6.Building 7.Tuition 8.Food Service 9.Impact Aid 10.Capital Improvement (OTO) (June 30, 2016) 11.Compensated Absence
- 12. Traffic Education
- 13. Inter-local Agreement
- 14. K-12 Data Systems (2013)
- 15. Rate Stabilization
Reserve
- 16. Medicaid
- 17. Indirect Cost
- 18. RIDE
- 19. Kindergarten (OTO) (2014)
- 20. Athletic Revenue
Enhancement
General Fund Budget Reserve Amount
- For cash flow purposes (Checkbook balance at the end of the month)
- School does not receive revenue in July
- General Fund Reserve Amount at the end of the
year reduce taxes for the upcoming year.
- Available uses under MCA 20-9-161
– Unanticipated Enrollment Increase – Destruction or impairment of school property by fire, flood, storm, riot, insurrection or act of God which renders property unfit for use – Judgment against the district issued by a court after the adoption of the budget
Reserves are categorized by law
The reserve funds are categorized by the Governmental Accounting Standards Board (GASB) into 5 categories:
– Non-spendable: Resources are not in spendable form or are legally required
to remain intact
- Examples: inventories - purchased food in freezers, warehouse items, technology items
– Restricted: There are constraints on the fund that are EXTERNALLY imposed by
- A 3rd party (grantor, contributor);
- The State Constitution; or
- Other enabling legislation
– Committed: There are constraints on the fund that are INTERNALLY imposed by
the highest level of authority (School Board)
- General Fund Reserve approved by Board
– Assigned: There are constraints on the fund as an INTERNAL expression of intent
by the governing body or authorized official
– Unassigned: No constraints
- General Fund budget money at the end of the year that goes back to reduce taxes for the next
budget year.
Discussion tonight will focus on restricted and assigned reserves. Flexibility in Spending
Reserves are “budgeted” or “not budgeted”
- Budgeted funds: A budget for the fund is
presented annually to the Board in August and the Board votes on those budgets.
- The General Fund budget
- GFPS has 6 Board adopted reserve funds:
- State sets % limits on all budgeted funds.
- 1. Transportation (20%)
- 2. Retirement (20%) (Elem 12.86%) County
- 3. Adult Education (35%)
- 4. Technology (N/A) Fund Balance Re-appropriated
- 5. Flexibility Fund (N/A) Fund Balance Re-appropriated
- 6. Building Reserve (N/A) Fund Balance Re-appropriated
What role do they have in budgeting?
- Designated reserve fund accounts play a critical role
in sound financial management because, by law, school districts budget their costs one year at a time.
– Budgeted funds provide for foreseeable obligations:
- Examples: transportation, food service, pension and health care
costs, etc.
– Reserve funds provide for unforeseeable expenses
- Examples: facility issues, drastic enrollment changes, etc.
– Reserve funds provide funding for cash flow given the revenue mechanisms of school districts. They prevent the need to borrow money. (Timing of when the district receives the revenue) – Reserve funds are generally not recommended to be spent for on-going costs unless there is certainty that they will be replenished
Terms and Concepts
5 10 15 20 25 30 35 40 45 50 Jul Oct Jan Apr Remaining Budget Cash Balance
“Budget” means spending authority— NOT “cash”!
Source: Montana Association of School Business Officials (MASBO)
2000 4000 6000 8000 10000 12000 July Aug Sept Oct Nov Dec Jan Feb Mar April May June
Revenue by Month
General Fund Budget Cash Flow
1000 2000 3000 4000 5000 6000 7000 8000 9000 10000 July Aug Sept Oct Nov Dec Jan Feb Mar April May June
Expenditures by Month
General Fund Budget Cash Flow
2000 4000 6000 8000 10000 12000 July Aug Sept Oct Nov Dec Jan Feb Mar April May June
Revenues and Expenditures by Month
General Fund Budget Cash Flow
Federal Funds Operational Change
- Change from request then spend
- Now Spend then request (Cash flow)
Fund Description State Law Purpose Voting Requirements Trend Data 2002-2016 Graph
Resources
– Brian Patrick
Director of Business Operations Great Falls Public Schools
– Information on District Web Page
– http://www.gfps.k12.mt.us
– District Budget Information
– http://www.gfps.k12.mt.us/sites/default/files/GF PS_DistrictBudgetInformation2.pdf
- brian_patrick@gfps.k12.mt.us
- 268-6050
Thank You! Questions?
- Fiscal Operation of the District
- High expectations
District-Wide Macro Budget Presentation
Community Budget Meeting Brian Patrick February 2, 2016
General Fund Budget $69,376,744
General Fund Macro Expenditures
Districtwide Operations K-8 Instructional 9-12 Instructional
$33,031,469 = K-8 Instruction
- Asst. Supt. K-6
Ruth Uecker
General Fund Macro Expenditures
Districtwide Operations K-8 Instructional 9-12 Instructional
General Fund Macro Expenditures
Districtwide Operations K-8 Instructional 9-12 Instructional
$16,532,555 = 9-12 Instruction
- Asst. Supt. 7-12
Tom Moore
$19,812,719 Director of Business Operations Brian Patrick
General Fund Macro Expenditures
Districtwide Operations K-8 Instructional 9-12 Instructional
15-16 Budgeted General Fund Sub-Macro Expenditures District-wide Operations
$19,812,719
Program Code
Salaries & Benefits 17.87% Utilities & Assesments 3.45% Supplies & Equipment 1.75% Financial Expenditures 1.18% Educational/Curriculum 2.13% Personnel Related .49% Property & Liability Ins. .87% Vehicle and Trasport .14% Fees 1.17% Minor Construction .59% Assistant Elementary Supt 28.56% Assistant High School Supt 23.83%
Salaries & Benefits $11,904,033 Utilities & Assessments $2,064,419 Supplies and Equipment $957,678 Financial Expenditures $781,438 Educational/Curriculum $1,685,610 Personnel Related $198,085 Property & Liability Ins. $493,140 Vehicle and Transport $135,335 Fees $791,210 Minor Construction $801,772 Assistant Elementary Supt. $33,031,469 Assistant High School Supt $16,532,555
15-16 Budgeted General Fund Sub-Macro Expenditures District-wide Operations
$19,812,719
Object Code
Curriculum 1.79% Technology 2.58% Athletics/Health/Music 2.39% HR/Print Center/Purchasing/Warehouse 1.23% Safety .05% Plant Operations 10.5% Maintenance 2.63% Assistant Elementary Supt 28.56% Assistant High School Supt 23.83% Districtwide 8.46%
Curriculum $1,248,186 Technology $1,861,666 Athletics/Health/Music $1,619,342 HR/PrintCenter/Purchasing/Warehouse $692,033 Safety $38,151 Plant Operations $6,997,316 Maintenance $1,961,494 Assistant Elementary Supt. $33,031,469 Assistant High School Supt $16,532,555 Districtwide $5,455,030
Questions?
K-8 MACRO BUDGET INFORMATION
Ruth Uecker Elementary Education Assistant Superintendent K-6 February 2, 2016
Elementary Budget: K-8 Instructional Related Items
- 15 Elementary Schools (K-6)
- 5705 Students (-109)
- 2 Middle Schools (7-8)
- 1484 Students (+ 9)
Note: Enrollment numbers from the October 5, 2015 official count day
- $24,769,928.84
Elementary Budget K-6
- $8,261,540.02
Middle School Budget 7-8
- $33,031,468.86
Total K-8 Instructional Budget
Our Kids: Instruction
Salaries and Benefits Teacher Salaries Benefits * Administrators Other Salaries ** Paraprofessionals/Aides Clerical Stipends Substitute salaries Overtime Total * FICA, unemployment, workman's comp., health ins., life & disability ins. ** Occupational & physical therapist, speech pathologist, psychologist, library, nurse, homeless coordinator $23,328,423.10 $3,118,331.92 $1,813,205.00 $1,961,122.36 $813,131.00 $617,956.00 $127,143.00 $14,000.00 $3,300 $31,796,612.38 This reflects approximately 96%
- f the total K-8 budget.
Our Kids: Supplies and Materials
- Books and instructional related
materials
- Replacement supplies and
maintenance
- Instructional supplies
- Equipment
- Total:
- 3% of the total K-8 budget
- $119,606.00
- $7,500.00
- $ 689,135.00
- $ 90,509.00
- $906,750.00
Our Future: Professional Development/Contracted Services
- Comprehensive professional development plan
- Paraprofessional training
- New teacher training/mentoring: Three years
- Professional Learning Community Time (PLCT)
- Curriculum adoption
- Ongoing PD throughout the year
- Budget categories:
- Contracted Services
$ 90,500.00
- Out of District
$ 65,100.00
- Professional Contracted Services
$133,906.48
- SRO’s
- Total
$289,506.48
Other:
- Dues & fees to professional organizations $ 10,900.00
- Field Experiences
$ 27,700.00 Total $ 38,600.00
- $33,031,468.86
Total K-8 Instructional Budget
Elementary Enrollment K-6
October official count numbers
Projected Kindergarten Enrollment Numbers
- 2015: 784 Actual Enrollment (Projected 871)
- 2016: 891 projected
- 2017: 832 projected
- 2018: 854 projected
- 2019: 829 projected
- 2020: 829 projected
- 2021: 829 projected
Kindergarten Enrollment
Challenge: Overloaded Classrooms K-6
- 2009-2010, we had 38
- 2012-2013, we had 60
- 2013-2014, we had 62
- 2014-2015, we had 80
- 2015-2016, we had 65
Accreditation Standard Students per Classroom Number Of Overloaded Classrooms K-2: 20 50 3-4: 28 11 5-6: 30 4 Total 65
Current Initiatives:
- STUDENT ACHIEVEMENT: Implementation of new ELA
resource materials
- STUDENT ACHIEVEMENT: Focus on writing standards
- STUDENT ACHIEVEMENT: Plan Management System (yr2)
- STUDENT ACHIEVEMENT: Graduation Matters Goal-
Kindergarteners prepared to succeed. Preschool outreach
- HEALTHY SAFE AND SECURE SCHOOLS: District Facility
Discussion
- STEWARDSHIP AND ACCOUNTABILITY: Implementation of
Teacher Evaluation System/Goal Setting
- STEWARDSHIP AND ACCOUNTABILITY: Building Leaders
through discussion group opportunity.
Future Initiatives:
- Implementation of Pre K-12 Technology standards
- Digital citizenship, concepts and operations, critical thinking,
research, creativity and innovation, communication and collaboration
- Professional development Trauma Informed Schools
- Continued support with standards based instruction
- ELA/Writing
- Math
- Data informed instruction to customize learning
- Implement new assessment tool
- Handwriting Committee
Questions?
9-12 MACRO BUDGET INFORMATION
Tom Moore Secondary Education Assistant Superintendent 7-12 February 2, 2016
Overview of High School Budget
- 3 High Schools : total enrollment- 2991
- Great Falls High School- (1388) , CM Russell High
School- (1419) and Paris Gibson Education Center-(184)
- $16,532,555
General Fund Macro Expenditures
Districtwide Operations K-8 Instructional 9-12 Instructional
Our Kids: 9-12 Instruction
Salaries and Benefits Teacher Salaries Benefits * Administrators Other Salaries ** Aides Clerical Stipends Substitute salaries * FICA, unemployment, workman's comp., health ins., life & disability ins. ** Occupational & physical therapist, speech pathologist, psychologist $11,793,498 $1,618,548 $814,311 $426,163 $191,528 $616,100 $122,577 $11,000 Total $15,593,725 (94.3%)
Supplies, Materials, Field trips, Equipment Replacement/Repair
- Books and instructional
related materials
- Instructional supplies
- Instructional field trips
- Equipment-minor/major
- Vehicle Maintenance
and repair
- $56,000
- $ 433,651
- $13,077
- $ 59,262
- $5,750
- Total $567,740
- (3.43%)
Our Community: Programs
- Contracted professional
services
- SRO-
- Tech Services
- Artist in Residence
- Travel- School Safety
- $173,653
- $1,500
Total $175,153 (1.05%)
Professional Development
- Comprehensive professional development plan
- Paraprofessional training
- New teacher training/mentoring: Three years
- Professional Learning Community Time (PLCT)
- Curriculum adoption
- Ongoing PD throughout the year
- Budget categories:
- Contracted Services
$ 103,612
- Travel
$ 72,476 Total $ 176,088 (1.06%)
Other:
- Dues & fees to professional organizations
$19,850 (.02%)
Our Future:
Projected HS Enrollment Numbers
- 2013: 3,066-actual
- 2014: 3034-actual
- 2015: 2,991- Actual (2,997- projected)*
- 2016: 2,979 Projected
- 2017: 2,928
- 2018: 2,980
- 2019: 3,054
- 2020: 3,136
Secondary Initiatives:
- Increase the on time graduation rate while reducing the number of
dropouts
- Implement the Differentiated diplomas for 9-12 students
- Add Computer Science and Multiple Dual credit opportunities
- Provide meaningful customized learning plans for all students
- Increase access to the district drug and alcohol/mental health
resources for students
- Reduce chronic absenteeism
- Fully implement a cohesive instructional framework across all
secondary classrooms
- Operationalize a walkthrough tool to reflect Teacher effectiveness
- Develop a meaningful and effective common district assessment
process in secondary content areas
- Improve the preparedness of our students to take the ACT
Questions?
TECHNOLOGY MACRO BUDGET INFORMATION
Tom Hering Director of Informational Technology February 2, 2016
Budget – Technology
Salary, $1,063,734 , 57% Benefits, $133,548 , 7% Tech Serv., $200,439 , 11% Supplies, $380,595 , 20% Misc Expenses, $83,350 , 5%
2015-2016 Technology Budget $1,861,666
Revenue - Technology
[CATEGORY NAME], [VALUE], [PERCENTAGE] Tech [CATEGORY NAME], [VALUE], [PERCENTAGE] [CATEGORY NAME], [VALUE], [PERCENTAGE] [CATEGORY NAME], [VALUE], [PERCENTAGE] [CATEGORY NAME] Fund, [VALUE], [PERCENTAGE]
2014-2015 Technology Revenue $2,192,575
Technology Law Changes
Law for Current Levy New Levy Law
- Levies approved prior to July 1, 2013
- Can be permanent or durational
- Annual levy cannot exceed 20% of the
- riginal cost of equipment owned by
the district
- Amount levied over time cannot
exceed 150% of the original cost of the equipment
- $$ can be used for equipment, network
access and training of school personnel
- Levies approved after July 1, 2013
- May not exceed 10 years
- Can be based on all allowable
costs listed in the statute (equipment, cloud storage, training, etc.)
- Districts with an existing perpetual
levy can
- Ask for an increase in the amount of
the levy to cover cloud computing and training, and/or
- Seek relief from tracking depreciation
under existing levy
- Can propose a duration for each, not to
exceed 10 years
Technology Levy Distribution
East Middle School, $15,879.02 North Middle School, $16,375.90 Chief Joseph Elementary, $6,589.25 Lewis & Clark Elementary, $9,376.18 Lincoln Elementary, $9,354.58 Longfellow Elementary, $6,805.29 Loy Elementary, $8,684.85 Meadow Lark Elementary, $10,477.99 Morningside Elementary, $6,870.11 Mountain View Elementary, $6,999.73 Riverview Elementary, $9,678.64 Roosevelt Elementary, $6,826.90 Sacajawea Elementary, $9,397.79 Sunnyside Elementary, $9,894.68 West Elementary, $10,477.99 Valley View Elementary, $8,771.27 Whittier Elementary, $5,725.09 Early Learning Facility, $1,814.74 Great Falls High School, $31,694.64 Paris Gibson Education Center, $6,906.22 C.M. Russell High School, $33,399.14 Reserves, $18,000.00
2015-2016 Technology Levy Elementary - $150,000 / Secondary - $75,000
Technology Levies – AA Districts
Great Falls Public Schools 10,500 Missoula Public Schools 8,880 Helena Public Schools 8,332 Bozeman Public Schools 6,510 Billings Public Schools 17,112 Kalispell Public Schools* 3,130 Butte Public Schools 4,401 $22.05 $184.06 $130.72 $92.92 $117.08 $185.45 $0.00 $231,538 $1,634,493 $1,089,145 $604,923 $2,003,520 $580,459 $0
AA DISTRICT TECHNOLOGY LEVIES
* Levy for Elementary only. H.S. from General fund.
Reported from MT OPI GEMS FY 2015
Computer Devices by Age
Model Count Status Model Count Status Model Count Status
Latitude 3150 200 Latitude 2120 441 Latitude 2100 141 Latitude E5440 52 Latitude E6400 375 Latitude 2110 195 Latitude E5450 16 Latitude E6410 166 Latitude D430 3 Latitude E6430 24 Latitude E6420 431 Latitude D531 15 Latitude E6440 36 OptiPlex 740 885 Latitude D620 19 Latitude E6540 3 OptiPlex 740 Enhanced 1426 Latitude D630 8 OptiPlex 3020 5 Total 3724 OptiPlex 745 185 OptiPlex 3020M 44 OptiPlex 755 57 OptiPlex 7010 339 OptiPlex 760 13 OptiPlex 780 1024 OptiPlex GX520 100 OptiPlex 790 433 OptiPlex GX620 45 OptiPlex 9020 125 Total 781 Venue 11 Pro 5130 3 Total 2304 iPod touch 4 G 125 iPod Touch 5G 90 iPad 2 499 iPad 3rd Gen 82 Out of warranty and greater than 3 years old. Refresh with 1-2 years. iPad 4th Gen 117 Reburbished equipment $1,188,014 iPad Air 65 $1,862,000 iPad Air 2 93 iPad Mini 3 1 Total iOS 1072 $260,000 $390,000 TOTAL 3376 Under warranty and within 5 year life span. Out of warranty and greater than 5 years old. Refresh now. Reburbished equipment New equipment New equipment
Questions?
CLOSING REMARKS
Trustee Don Ryan, Board Budget Committee Chairperson
Next meeting:
- Weds. Feb. 17, 2016; 5:30-7:00 p.m.
State & Federal Revenue Projections; Expense Projections