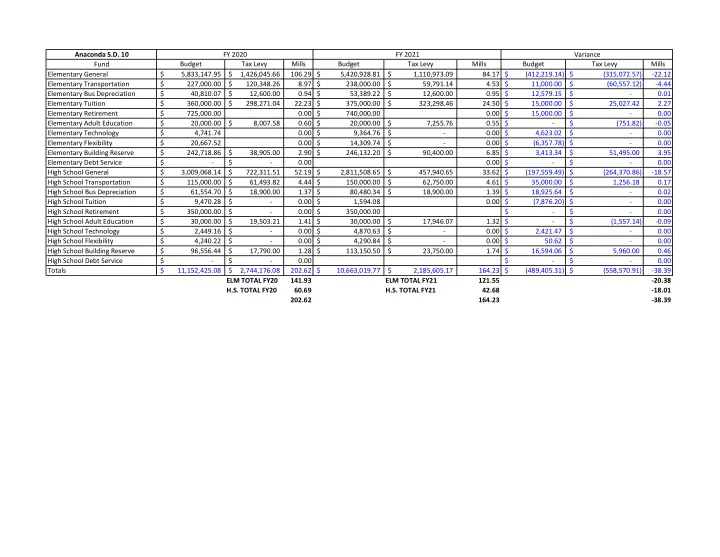
anaconda s d 10 fy 2020 fy 2021 variance budget tax levy
play

Anaconda S.D. 10 FY 2020 FY 2021 Variance Budget Tax Levy Mills - PowerPoint PPT Presentation

Anaconda S.D. 10 FY 2020 FY 2021 Variance Budget Tax Levy Mills Budget Tax Levy Mills Budget Tax Levy Mills Fund Elementary General $ 5,833,147.95 $ 1,426,045.66 106.29 $ 5,420,928.81 $ 1,110,973.09 84.17 $ (412,219.14) $


  1. Anaconda S.D. 10 FY 2020 FY 2021 Variance Budget Tax Levy Mills Budget Tax Levy Mills Budget Tax Levy Mills Fund Elementary General $ 5,833,147.95 $ 1,426,045.66 106.29 $ 5,420,928.81 $ 1,110,973.09 84.17 $ (412,219.14) $ (315,072.57) -22.12 Elementary Transportation $ 227,000.00 $ 120,348.26 8.97 $ 238,000.00 $ 59,791.14 4.53 $ 11,000.00 $ (60,557.12) -4.44 Elementary Bus Depreciation $ 40,810.07 $ 12,600.00 0.94 $ 53,389.22 $ 12,600.00 0.95 $ 12,579.15 $ - 0.01 Elementary Tuition $ 360,000.00 $ 298,271.04 22.23 $ 375,000.00 $ 323,298.46 24.50 $ 15,000.00 $ 25,027.42 2.27 Elementary Retirement $ 725,000.00 0.00 $ 740,000.00 0.00 $ 15,000.00 $ - 0.00 Elementary Adult Education $ 20,000.00 $ 8,007.58 0.60 $ 20,000.00 $ 7,255.76 0.55 $ - $ (751.82) -0.05 Elementary Technology $ 4,741.74 0.00 $ 9,364.76 $ - 0.00 $ 4,623.02 $ - 0.00 Elementary Flexibility $ 20,667.52 0.00 $ 14,309.74 $ - 0.00 $ (6,357.78) $ - 0.00 Elementary Building Reserve $ 242,718.86 $ 38,905.00 2.90 $ 246,132.20 $ 90,400.00 6.85 $ 3,413.34 $ 51,495.00 3.95 Elementary Debt Service $ - $ - 0.00 0.00 $ - $ - 0.00 High School General $ 3,009,068.14 $ 722,311.51 52.19 $ 2,811,508.65 $ 457,940.65 33.62 $ (197,559.49) $ (264,370.86) -18.57 High School Transportation $ 115,000.00 $ 61,493.82 4.44 $ 150,000.00 $ 62,750.00 4.61 $ 35,000.00 $ 1,256.18 0.17 High School Bus Depreciation $ 61,554.70 $ 18,900.00 1.37 $ 80,480.34 $ 18,900.00 1.39 $ 18,925.64 $ - 0.02 High School Tuition $ 9,470.28 $ - 0.00 $ 1,594.08 0.00 $ (7,876.20) $ - 0.00 High School Retirement $ 350,000.00 $ - 0.00 $ 350,000.00 $ - $ - 0.00 High School Adult Education $ 30,000.00 $ 19,503.21 1.41 $ 30,000.00 $ 17,946.07 1.32 $ - $ (1,557.14) -0.09 High School Technology $ 2,449.16 $ - 0.00 $ 4,870.63 $ - 0.00 $ 2,421.47 $ - 0.00 High School Flexibility $ 4,240.22 $ - 0.00 $ 4,290.84 $ - 0.00 $ 50.62 $ - 0.00 High School Building Reserve $ 96,556.44 $ 17,790.00 1.28 $ 113,150.50 $ 23,750.00 1.74 $ 16,594.06 $ 5,960.00 0.46 High School Debt Service $ - $ - 0.00 $ - $ - 0.00 Totals $ 11,152,425.08 $ 2,744,176.08 202.62 $ 10,663,019.77 $ 2,185,605.17 164.23 $ (489,405.31) $ (558,570.91) -38.39 ELM TOTAL FY20 141.93 ELM TOTAL FY21 121.55 -20.38 H.S. TOTAL FY20 60.69 H.S. TOTAL FY21 42.68 -18.01 202.62 164.23 -38.39

  2. Anaconda S.D. 10 Elementary High School Year Taxable Value Variance Taxable Value Variance 2021 $ 13,197,766 $ (217,915) -1.77% $ 13,615,668 $ (223,707) -1.76% 2020 $ 13,415,681 $ 1,054,823 8.53% $ 13,839,375 $ 1,076,034 8.43% 2019 $ 12,316,700 $ (44,158) -0.36% $ 12,719,643 $ (43,698) -0.34% 2018 $ 12,360,858 $ 555,987 4.71% $ 12,763,341 $ 391,865 3.17% 2017 $ 11,804,871 $ 162,941 1.40% $ 12,371,476 $ 336,059 2.79% 2016 $ 11,641,930 $ 43,453 0.37% $ 12,035,417 $ 54,577 0.46% 2015 $ 11,598,477 $ (470,004) -3.89% $ 11,980,840 $ (462,040) -3.71% 2014 $ 12,068,481 $ 965,019 8.69% $ 12,442,880 $ 979,743 8.55% 2013 $ 11,103,462 $ 71,437 0.65% $ 11,463,137 $ 83,499 0.73% 2012 $ 11,032,025 $ 169,321 1.56% $ 11,379,638 $ 167,156 1.49% 2011 $ 10,862,704 $ (108,676) -0.99% $ 11,212,482 $ (105,699) -0.93% 2010 $ 10,971,380 $ 234,052 2.18% $ 11,318,181 $ 313,865 2.85% 2009 $ 10,737,328 $ 427,796 4.15% $ 11,004,316 $ 441,469 4.18% 2008 $ 10,309,532 $ 560,154 5.75% $ 10,562,847 $ 562,424 5.62% 2007 $ 9,749,378 $ 340,193 3.62% $ 10,000,423 $ 345,233 3.58% 2006 $ 9,409,185 $ 594,081 6.74% $ 9,655,190 $ 601,827 6.65% 2005 $ 8,815,104 $ 356,620 4.22% $ 9,053,363 $ 360,220 4.14% 2004 $ 8,458,484 $ 253,363 3.09% $ 8,693,143 $ 253,384 3.00% 2003 $ 8,205,121 $ (133,840) -1.60% $ 8,439,759 $ (135,029) -1.57% 2002 $ 8,338,961 $ 79,530 0.96% $ 8,574,788 $ 71,305 0.84% 2001 $ 8,259,431 $ (572,199) -6.48% $ 8,503,483 $ (599,867) -6.59% 2000 $ 8,831,630 $ (596,600) -6.33% $ 9,103,350 $ (604,890) -6.23% 1999 $ 9,428,230 $ 9,708,240

  3. ELM H.S. Total FY09 139.43 70.91 210.34 FY10 136.2 68.81 205.01 FY11 143.3 69.04 212.34 FY12 137.42 67.12 204.54 Mill Comparison FY13 132.69 66.11 198.8 FY14 139.17 71.94 211.11 450 FY15 127.52 66.51 194.03 FY16 121.22 60.87 182.09 400 FY17 104.56 59.91 164.47 FY18 129.25 63.37 192.62 350 FY19 110.5 50.28 160.78 FY20 141.93 60.69 202.62 300 FY21 121.55 42.68 164.23 250 Total Mills 200 H.S. ELM 150 100 50 0 FY09 FY10 FY11 FY12 FY13 FY14 FY15 FY16 FY17 FY18 FY19 FY20 FY21 Total 210.34 205.01 212.34 204.54 198.8 211.11 194.03 182.09 164.47 192.62 160.78 202.62 164.23 H.S. 70.91 68.81 69.04 67.12 66.11 71.94 66.51 60.87 59.91 63.37 50.28 60.69 42.68 ELM 139.43 136.2 143.3 137.42 132.69 139.17 127.52 121.22 104.56 129.25 110.5 141.93 121.55

  4. Anaconda S.D. 10 2020 2021 Difference Tax Levy Tax Levy Tax Levy Fund Elementary General $ 1,426,045.66 $ 1,110,973.09 $ (315,072.57) Elementary Transportation $ 120,348.26 $ 59,791.14 $ (60,557.12) Elementary Bus Depreciation $ 12,600.00 $ 12,600.00 $ - Elementary Tuition $ 298,271.04 $ 323,298.46 $ 25,027.42 Elementary Retirement $ 474,597.23 $ 750,000.00 $ 275,402.77 29.33740795 Elementary Adult Education $ 8,007.58 $ 7,255.76 $ (751.82) Elementary Technology $ - $ - Elementary Flexibility $ - $ - Elementary Building Reserve $ 38,905.00 $ 90,400.00 $ 51,495.00 Elementary Debt Service $ - $ - High School General $ 722,311.51 $ 457,940.65 $ (264,370.86) High School Transportation $ 61,493.82 $ 62,750.00 $ 1,256.18 High School Bus Depreciation $ 18,900.00 $ 18,900.00 $ - High School Tuition $ - $ - High School Retirement $ 172,502.26 $ 350,000.00 $ 177,497.74 19.87474227 High School Adult Education $ 19,503.21 $ 17,946.07 $ (1,557.14) High School Technology $ - $ - $ - High School Flexibility $ - $ - $ - High School Building Reserve $ 17,790.00 $ 23,750.00 $ 5,960.00 High School Debt Service $ - $ - $ - Totals $ 3,391,275.57 $ 3,285,605.17 $ (105,670.40) Mill Value (Avg between Elm and H.S.) 13,580 Mill Increase from 2020 $ (7.78) Total Tax Increase decrease in Dollars $ (105,670.40) Est. Annual Tax Impact $100K home $ (10.50)

Download Presentation
Download Policy: The content available on the website is offered to you 'AS IS' for your personal information and use only. It cannot be commercialized, licensed, or distributed on other websites without prior consent from the author. To download a presentation, simply click this link. If you encounter any difficulties during the download process, it's possible that the publisher has removed the file from their server.

Recommend


More recommend