
SLIDE 1
6/19/2018 1
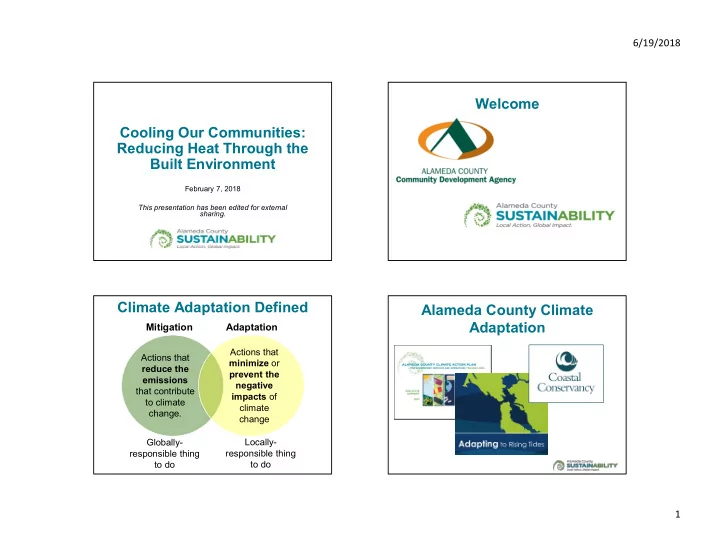
Cooling Our Communities: Reducing Heat Through the Built Environment
February 7, 2018 This presentation has been edited for external sharing.
Welcome Cooling Our Communities: Reducing Heat Through the Built - - PowerPoint PPT Presentation
6/19/2018 Welcome Cooling Our Communities: Reducing Heat Through the Built Environment February 7, 2018 This presentation has been edited for external sharing. Climate Adaptation Defined Alameda County Climate Adaptation Mitigation
February 7, 2018 This presentation has been edited for external sharing.
Increased Temperatures Sea Level Rise Extreme Storms Wildfires
Increased Temperatures Sea-Level Rise Wildfires Extreme Storms
+Improved Air Quality
42 February 7, 2018
Office of Planning and Environmental Review
43 February 7, 2018
Office of Planning and Environmental Review
44 February 7, 2018
Office of Planning and Environmental Review
45 February 7, 2018
Office of Planning and Environmental Review
46 February 7, 2018
Office of Planning and Environmental Review
47 February 7, 2018
Office of Planning and Environmental Review
48 February 7, 2018
Office of Planning and Environmental Review
49 February 7, 2018
Office of Planning and Environmental Review
Project (Slide 18)
Wildmoser, Noun Project (Slide 18)
(Slide 18)
(Slide 18)
Impervious Surfaces, Tree Cover): Courtesy of Matt Beyers, Alameda County Public Health Department (Slides 21, 22, 23, 36, 37)
Alameda County Public Health Department (Slides 24, 25, 35)
34) In order of appearance in presentation. Photos not listed are labeled for reuse without attribution.
(Slide 34)
34)
(Slide 34)
39)
EvanstonNow.com, Newstory (2015) (Slide 40)
Alliance for Community Trees (2014) (Slide 41)
Livable Sudbury (Slide 43)