
Wedge
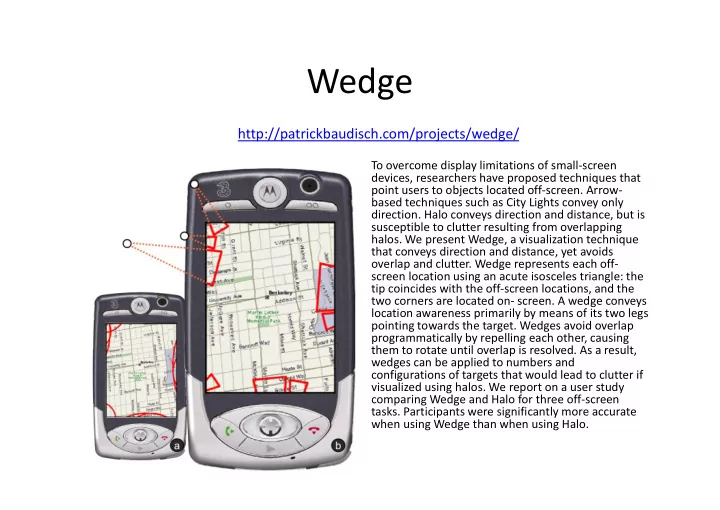
To overcome display limitations of small-screen devices, researchers have proposed techniques that point users to objects located off-screen. Arrow- based techniques such as City Lights convey only
- direction. Halo conveys direction and distance, but is
susceptible to clutter resulting from overlapping
- halos. We present Wedge, a visualization technique
that conveys direction and distance, yet avoids
- verlap and clutter. Wedge represents each off-
screen location using an acute isosceles triangle: the tip coincides with the off-screen locations, and the two corners are located on- screen. A wedge conveys location awareness primarily by means of its two legs pointing towards the target. Wedges avoid overlap programmatically by repelling each other, causing them to rotate until overlap is resolved. As a result, wedges can be applied to numbers and configurations of targets that would lead to clutter if visualized using halos. We report on a user study comparing Wedge and Halo for three off-screen
- tasks. Participants were significantly more accurate
when using Wedge than when using Halo.
http://patrickbaudisch.com/projects/wedge/