ASRAC Pumps Working Group Metric Construct Details BUILDING - - PowerPoint PPT Presentation
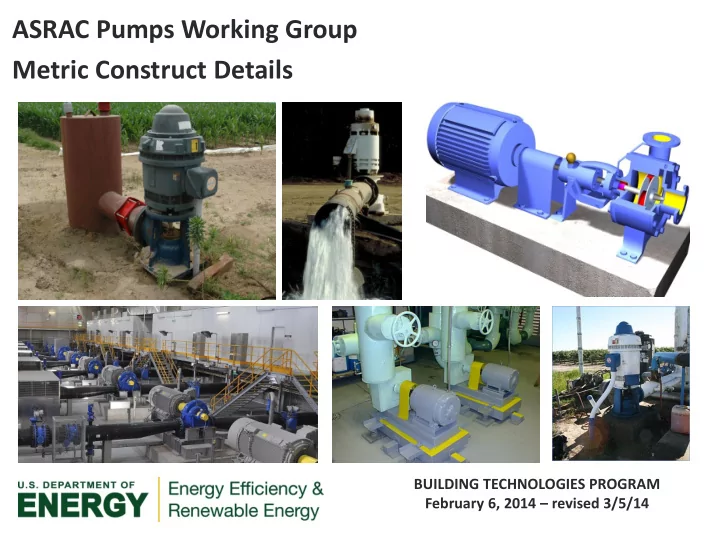
ASRAC Pumps Working Group Metric Construct Details BUILDING TECHNOLOGIES PROGRAM February 6, 2014 revised 3/5/14 Metric Applicability to Pump Configurations Pump Configuration Bare Pump Bare Pump + Motor Bare Pump + Motor + Controls Pump
2
Metric Applicability to Pump Configurations
Pump Configuration
Bare Pump Bare Pump + Motor Bare Pump + Motor + Controls
Metric Coverage Bare Pump Does not include motor efficiency Does not describe control losses or benefits Bare Pump + Motor (w/ std. motor) Does not describe control losses or benefits Bare Pump + Motor + Controls (w/ std. motor and controls) (w/ std. controls)
Pump
Motor
Pump
Motor
Control
Pump
3
Covered Product Metric
Bare Pump Efficiency
- r Energy
Use Motor Efficiency
- r Energy
Use Controls Efficiency
- r Energy
Use ‘Pump’ Efficiency or Energy Use =
4
Possible Metric
Pump Energy Rating (PER): equally weighted average electric input power (P1) to the ‘pump’ measured (or calculated) at the motor input or, when present, controls input, over a specified load profile (100%, 75%, 50%, and 25% of Best Efficiency Point (BEP) flow at nominal speed).
- For bare pump or pump+motor, achieve
part-load by throttling through pump curve at rated speed.
- For pump+motor+controls, achieve part-
load by reducing speed and correcting to a specified system curve shape.
PER = 0.25(P1BEP) + 0.25(P11.1BEP) + 0.25(P10.75 BEP) + 0.25(P10.5 BEP)
Notes: Denominator could be included in metric Rating point of 25% may not be appropriate/feasible for throttled configurations
5
PER Options
No Denominator Denominator Form Weighted average of pump input power at several load points Weighted input of pump input power at several load points normalized by pump hydraulic output power, a reference pump efficiency, or other value Units kW, Btu, or HP Dimensionless* Standard Strong function of flow and specific speed Weak function of flow and specific speed Pros Representative of the energy consumption of that pump in the field More comparable across pumps of different sizes/specific speeds; Similar to EEI approach in EU Cons Not comparable across pumps of different flows/specific speeds No reference pump efficiency in US, so difficult to set; other denominator
- ptions may not be logical (discussed on
next slide) *May vary based on denominator chosen
6
Denominator Options
Denominator Pros Cons Power consumption
- f same pump in an
uncontrolled system N/A This value gives no indication of the efficiency of the pump - two pumps with equivalent part-load performance and different efficiencies at BEP would have the same rated value. Reference shaft power for minimally compliant bare pump with minimally compliant motor Results in value between 0 and 1. Clearly indicates performance
- f a pump relative to a
baseline. Inherently requires designation of minimally compliant pump (i.e., MEI). May over- or under-represent the baseline efficiency for some pumps. Market average shaft power with minimally compliant
- r market average
motor Indicates performance of a pump relative to the market. Locks in the metric to the performance of pumps in the market at a given point in time. Doesn’t limit metric values between 0 and 1. Tested pump’s hydraulic power at BEP Accounts for differences in pump efficiencies between models. Has similar rated values for pumps of different sizes Lower PER rating for smaller pumps because lower capacity equipment is inherently less efficient.
7
×
standardized motor efficiency and part load curve
MOTOR
pump performance data from pump test at rated speed
Bare Pump Testing
×
standardized controls performance
Controls
Example of Motor Choice:
- If standard motor: AC Induction, NEMA Design B, open enclosure.
- Could use next HP above brake horsepower at 120% BEP or other
defined motor rating.
- Poles would be based on speed at which pump is being rated.
- If standard full load motor efficiency is used, it would be based on Federal
standards (assuming the motor is a type covered by Federal standards).
- Could use full load motor efficiency for all points or develop standard motor
part-load curves.
8
×
manufacturer motor efficiency at full and part load
A
MOTOR
B
MOTOR PUMP
Bare Pump + Motor Testing
Manufacturer can pair its pump data with manufacturer motor data. Manufacturer can measure power of pump+motor combo.
standardized controls performance
Controls
×
pump performance data from pump test at rated speed
standardized controls performance
Controls
×
9
pump performance from pump test at rated and reduced speed
×
motor/drive performance data
B C
VFD MOTOR
Controls
MOTOR PUMP
Bare Pump + Motor + Controls Testing
Manufacturer can pair its pump data with tested motor+VFD data. Manufacturer can measure power of pump+motor+ controls combo.
×
manufacturer or default motor efficiency
A
MOTOR Manufacturer can pair its pump data with manufacturer motor data and default controls credits.
pump performance data from pump test at rated speed default controls performance
Controls
×
10
Bare Pump/Bare Pump + Motor Equation
11
Bare Pump + Motor + Controls Equation
12
Issues to Discuss
13
Example of Metric Application
Note: The example on the following slides is provided for the limited purpose of demonstrating the potential application of the PER metric. It does not represent a decision by DOE on an appropriate metric or standard level for the products to be addressed by the pumps working group.
Values used to compare an example pump to the example calculated efficiency level are for illustration purposes only and should not be considered as representing recommended values. The comparison of the example PER metric to the MEI metric is provided only to demonstrate the results of the calculation, and does not represent an evaluation by DOE of the relative merits of one approach over the other.
14
How efficiency levels could be set
15
𝜃𝑞𝑣𝑛𝑞, BEP can be calculated the same way as in MEI, as a function of flow and specific speed.
𝜃𝑞𝑣𝑛𝑞 at 75%, 50%, and 25% can be calculated as a percentage of 𝜃𝑞𝑣𝑛𝑞, BEP
- In the EU, pump efficiency at 75% BEP flow must be 94.7% of 𝜃𝑞𝑣𝑛𝑞, BEP
- Using a subset of HI data (ESFM pump, 4 pole*), DOE analyzed part-load pump
efficiency as a percentage of BEP efficiency:
- The results, in the form of population average values, are as follows:
- At 75% BEP flow, 𝜃𝑞𝑣𝑛𝑞,0.75 is 95% of 𝜃𝑞𝑣𝑛𝑞, BEP
– Efficiency as a percent of 𝜃𝑞𝑣𝑛𝑞, BEP was independent of flow and fairly independent of specific speed – Agrees with EU value
- At 50% BEP flow, 𝜃𝑞𝑣𝑛𝑞,0.50 is 78.5% of 𝜃𝑞𝑣𝑛𝑞, BEP
– Estimated 𝜃𝑞𝑣𝑛𝑞, 0.50 by fitting 2nd order polynomials to the 75%, 100%, and 110% BEP efficiency data provided by HI. – Efficiency as a percent of 𝜃𝑞𝑣𝑛𝑞, BEP was independent of flow, fairly independent of specific speed, but showed a larger standard deviation than at 75% BEP (possibly due to estimating 𝜃𝑞𝑣
𝑛𝑞, 0.50 data)
- 25% BEP flow: No data available; this flow point is omitted for this analysis
*All equipment classes will be analyzed in the future
Setting Target Values
16
How efficiency levels could be set: Bare Pumps
With 𝜃𝑞𝑣𝑛𝑞, 0.50 and 𝜃𝑞𝑣𝑛𝑞, 0.75 defined as (0.785 x 𝜃𝑞𝑣𝑛𝑞, BEP) and (0.950 x 𝜃𝑞𝑣𝑛𝑞, BEP) respectively, and using full load motor efficiency for all points, the PEREff. Level equation can be simplified to:
𝑄𝐹𝑆𝐹𝑔𝑔.𝑀𝑓𝑤𝑓𝑚 = 1 𝜃𝑛𝑝𝑢𝑝𝑠 × 𝜕0.50 𝑄
ℎ𝑧𝑒𝑠𝑏𝑣𝑚𝑗𝑑,0.50
0.785 × 𝜃𝑞𝑣𝑛𝑞,𝐶𝐹𝑄 +𝜕0.75 𝑄
ℎ𝑧𝑒𝑠𝑏𝑣𝑚𝑗𝑑,0.75
0.950 × 𝜃𝑞𝑣𝑛𝑞,𝐶𝐹𝑄 +𝜕BEP 𝑄ℎ𝑧𝑒𝑠𝑏𝑣𝑚𝑗𝑑,𝐶𝐹𝑄 𝜃𝑞𝑣𝑛𝑞,𝐶𝐹𝑄
Where:
𝜃𝑞𝑣𝑛𝑞, BEP in this example is from the MEI surface, using flow and specific speed.
- If this approach is used, the actual value of 𝜃𝑞𝑣𝑛𝑞, BEP could be determined by the C-value or “MEI
Level” that is ultimately selected as a result of the standards analysis.
Please Note: the values of 0.785 and 0.950 are preliminary and are used for demonstration purposes only. If this approach is used for the rating metric and standard, the selection of actual values for these factors would be made based upon further analysis.
17
Example Scenario and Calculations
Given the Following Theoretical Pump and Parameters
- BEP Flow: 880 GPM
- BEP Head: 117 ft
- Specific Speed: 1500
- PBEP = 30.99 HP (Shaft), 26.0 HP (Hydro)
- P0.75 = 27.67 HP (Shaft), 22.4 HP (Hydro)
- P0.50 = 24.64 HP (Shaft), 17.6 HP (Hydro)
- 𝜃Motor, Default = 93%
- Load Point Weight = 1/3 [even]
𝑄𝐹𝑆𝐷𝑏𝑚𝑑𝑣𝑚𝑏𝑢𝑓𝑒 = 𝜕0.50 𝑄0.50 𝜃𝑛𝑝𝑢𝑝𝑠 + 𝜕0.75 𝑄0.75 𝜃𝑛𝑝𝑢𝑝𝑠 + 𝜕𝐶𝐹𝑄 𝑄𝐶𝐹𝑄 𝜃𝑛𝑝𝑢𝑝𝑠 𝑄𝐹𝑆𝐷𝑏𝑚𝑑𝑣𝑚𝑏𝑢𝑓𝑒 = 1 0.93 × 1 3 × 24.64𝐼𝑄 + 27.67𝐼𝑄 + 30.99𝐼𝑄 = 29.86 𝐼𝑄
𝜃 BEP = 84.04% 𝜃 0.75 = 80.98% 𝜃 0.50 = 71.50%
18
Example Scenario and Calculations
PERCalculated: 29.23 𝜃 pump, BEP = 84.04% Passing C-Value for this Pump: 122.21
MEI Level C-Value
[EU Lot 11]
𝜃Pump, BEP
- PEREff. Level
10 132.58 75.33% 33.60 40 128.07 79.84% 31.70 70 124.85 83.06% 30.47 80 122.94 84.97% 29.79
These results demonstrate how the calculated PER for the example pump would compare to the example PER efficiency levels at each MEI cutoff level, compared with the C-value cutoff values for the same pump.
19
Setting Efficiency Levels
- PER =