
SLIDE 1
#libdata4impact
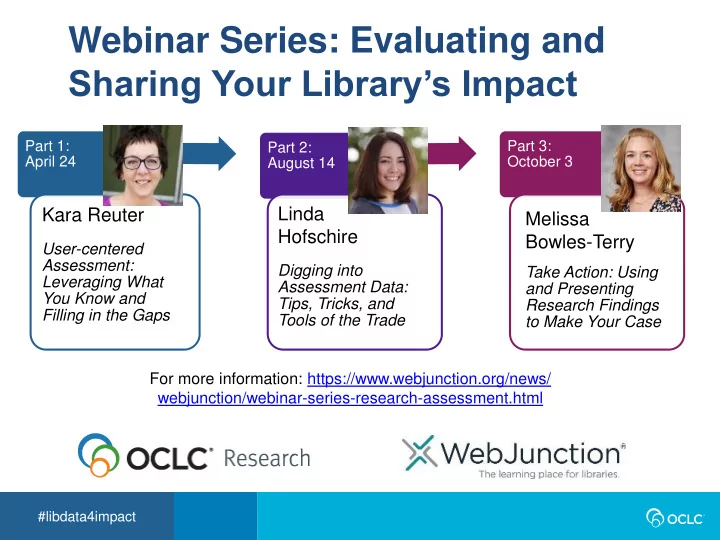
Webinar Series: Evaluating and Sharing Your Library’s Impact
Part 1: April 24
Kara Reuter
User-centered Assessment: Leveraging What You Know and Filling in the Gaps
Part 2: August 14
Linda Hofschire
Digging into Assessment Data: Tips, Tricks, and Tools of the Trade
Part 3: October 3
Melissa Bowles-Terry
Take Action: Using and Presenting Research Findings to Make Your Case For more information: https://www.webjunction.org/news/ webjunction/webinar-series-research-assessment.html