
SLIDE 1
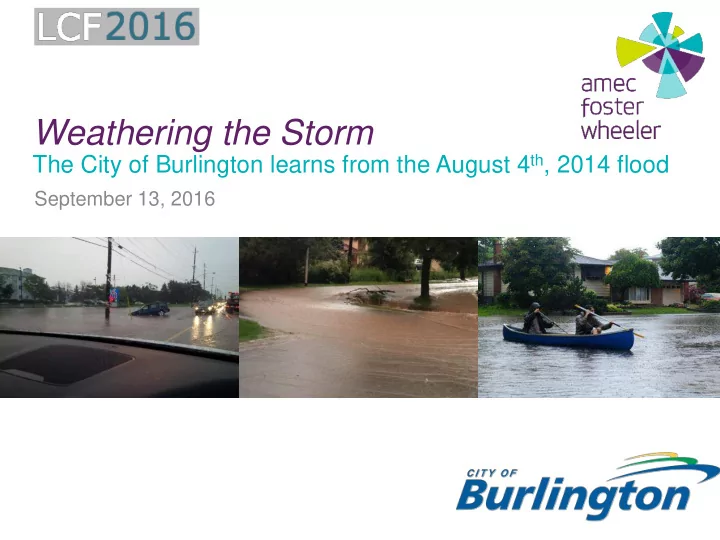
Weathering the Storm
The City of Burlington learns from the August 4th, 2014 flood
September 13, 2016
Weathering the Storm The City of Burlington learns from the August 4 - - PowerPoint PPT Presentation
Weathering the Storm The City of Burlington learns from the August 4 th , 2014 flood September 13, 2016 Agenda 1. The Flood 2. Characterization of the Storm 3. The Response 4. The Study 5. Lessons Learned 6. Next Steps 2 1. The Flood 3
The City of Burlington learns from the August 4th, 2014 flood
September 13, 2016
2
3
4
Burlington Halifax
5
Halifax
Burlington
6
Weather Network chief meteorologist Chris Scott called this summer storm an “Epic flash flooding event”, caused by training storms, a series of thunderstorms that moved over the same area several times in a short period of time.
196 mm of rain in 8 hours
7
Riverine Flooding - Tuck Creek at Driftwood Park
8
Riverine Flooding - Tuck Creek @ Elwood Drive
9
Riverine Flooding - Shoreacres Creek @ Mainway
10
Riverine Flooding - Shoreacres Creek south of New Street
11
12
Overland Flooding - ETR-407 south of Dundas Street
Overland Flooding - Tuck Creek @ Regal Road
13
Overland Flooding - Tuck Creek
14
Overland Flooding - Shoreacres Creek @ North Service Road
15
Overland Flooding - Appleby Creek @ Walkers Line – Lakeshore rail underpass
16
Local Flooding - Tuck Creek @ Notre Dame High School
17
Local Flooding - Shoreacres Creek @ Commercial Building
18
Local Flooding - Underground Parking Garages
19
20
Guelph Line north of Dundas Street
21
22
What caused the storm?
► Meteorological condition referred to as “Training” – a series of storm
cells that pass over a single area
► Causes:
in its ‘wake’
track
23
Rainfall Measurement
► Rain is measured using two technologies: radar and local (point)
gauges
► Radar data for Burlington are available from the US National Weather
Service (Buffalo) and Environment Canada (King City & Exeter)
► Conservation Halton determined that Buffalo data were most accurate by
comparing it to 34 local gauges (this was independently confirmed by AFW)
24
Rainfall Statistics – Comparing August 4, 2014 to design storms
► Rainfall period August 4, 2014 2:00 PM to 9:00 PM (Approximately 7 hours) ► Maximum rainfall depth = 196 mm (Roseland/Tuck Creek) ► Maximum rainfall intensity = 22.7 mm in 10 minutes (Shoreacres/Appleby Creek) ► Average rainfall depth by watershed
Design Standards
► Tuck Creek
150 mm
► Shoreacres Creek 140 mm ► Appleby Creek
130 mm
► Roseland Creek
120 mm
► Sheldon Creek
100 mm
25
100 Year (6 hours) is 87.7 mm Hurricane Hazel (12 hours) is 212 mm
26 May 2000 5 Year Storm 100 Year Storm August 4, 2014 Regional Storm 50 100 150 200 250
Rainfall Amount (mm) Rainfall Events
RAIN EVENT COMPARISON
27
28
29
Field Surveys of Damage
► City Operations staff was working during storm ► The following morning City staff was deployed to inspect and record
damage at key infrastructure locations
► Conservation Halton staff deployed to inspect high water levels and
damage
► Halton Region staff surveyed sanitary sewer related flooding ► Coordination between City, Halton Region and Conservation Halton
was very important.
30
Debris Cleanup
► Creek blockages from trees, shrubs, vegetation, sediment and rock ► Granular shoulders scoured away ► City tree crews, road crews and creek maintenance crews provided
cleanup services.
► Halton Region crews provided cleanup services ► Contractors hired to assist
31
Creek Debris Clean-Up by City
► Over 120 creek clean-up locations
32
Tuck Street south of New Street August 5, 2014 Trees, shrubs & vegetation
After clean up
33
Tuck Creek at Fairview Street August 5, 2014 Debris at major culverts
After clean up
34
Shoreacres Creek south of New Street August 5, 2014 Trees, shrubs & vegetation
After clean up
35
Shoreacres Creek south of South Service Road August 5, 2014 Broken shale transported downstream
After clean up
36
311 Call Registry / Database Development
► Over 3000 calls received regarding stormwater flooding and sanitary
sewer back-ups
► Coordinated effort between City of Burlington and Halton Region ► All 311 calls logged. Names, addresses and description of flooding
mechanisms recorded.
► GIS Mapping created for records. ► Coordinated with Halton Region
Database Development – GIS Mapping
37
Mapping Identifying Flood Locations & Mechanisms
► Engaged Consultant - Amec Foster Wheeler ► No initial Terms of Reference; Scope consultatively developed with
City
► Need for early actions
38
The Study
39
40
41
Region of Halton
where connected to sanitary
City of Burlington
Conservation Halton
Governance
42
Purpose/Approach
1.
Characterization of the August 4, 2014 flood response using hydrologic and hydraulic modelling
2.
Identification of prioritization of flood vulnerable areas, City wide
3.
Identification of mitigation opportunities
4.
A recommended list prioritized of capital flood mitigation projects
5.
Detailed site scale analysis and mitigation of flooding at sixteen (16) priority locations
43
Flood Characterization
► Methodology
► Establishing a single rainfall event hyetograph for the August 4, 2014 event,
based on the maximum recorded radar cell
► Simulating the cell uniformly across an entire subwatershed (conservative)
using a hydrologic model
► Extracting resulting flows and comparing
Max Cell
Flood Characterization
► August 4, 2014 (max. cell) and Regional Storm typically govern in medium to
large watersheds (combination of volume and intensity)
► 100 Year event governs in smaller (governed by intensity)
44
Governing Design Storm August 4th, 2014 (Max cell) Regional Storm 100 Year Storm Watersheds Most Impacted Aug 4, 2014
Flood Vulnerable Areas Desired outcome
► A list of the most flood vulnerable areas across the City ► A recommended list of prioritized flood mitigation projects
Approach 1. Identify Flood Vulnerable Areas (FVAs) 2. Characterize FVAs (quantitative) 3. Prioritize FVAs 4. Establish feasibility and cost of mitigation for priority FVAs 5. Prioritize mitigation projects (cost-benefit)
45
Flood Vulnerable Areas (FVAs) Flood Mechanisms Riverine Urban (road conveyance)
► Distinct analytical methods ► To allow prioritization, ‘vulnerability’ must be characterized using
common and comparable measures
46
Source: CTV News Source: CTV News
Identify Riverine FVAs
► Buildings within flood limits ► Primarily a mapping exercise
47
Characterize Riverine Flood Vulnerability
► Hydrologic and hydraulic modelling used to determine the frequency
buildings are vulnerable
► 2 Year? ► 100 Year?
48
Regional WSEL
City-Wide Riverine Flood Vulnerability
► 75 distinct Riverine FVAs identified ► 526 vulnerable buildings ► Residential land uses make up 90% of flood vulnerable buildings ► Southern part of the City is most vulnerable due to historic
development practices (pre-1970’s)
► 73% of vulnerable buildings are located within 3 subwatersheds – the
same 3 subwatersheds most affected August 4, 2014!
49
Identify Urban FVAs
► Identify ‘depression’ areas – no major system outlet
► Primarily a GIS assessment
50
Characterize Urban Flood Vulnerability
► Field reconnaissance and GIS analysis used to identify factors that
increased urban flood vulnerability:
► *Reverse driveways ► Potential depth of flooding ► Length of road impacted (related to emergency ingress/egress)
City-Wide Urban Flood Vulnerability
► 92 reverse driveways within depression areas identified ► 10 km of flood susceptible roadway identified
51
Prioritizing Vulnerability (Riverine and Urban)
► A fulsome flood damage reduction study considers social,
environmental and economic factors when prioritizing FVAs
► Schedule necessitated a simpler approach ► A ‘flood score’ (measure of risk) was developed for each FVA based on:
► Number of buildings at risk ► Land use ► *Frequency of flood risk (significant weight assigned to more frequent
flooding)
► Provided consistency between two (2) fundamentally different flood
mechanisms – critical to prioritizing capital expenditure
52
Flood Mitigation Opportunities Long List of Alternatives
53
► Site Scale (Individual FVA)
► Conveyance Improvements ► Flood Proofing ► Property Acquisition
► Subwatershed Scale (Multiple
FVAs)
► Stormwater Management ► Diversions
Flood Mitigation Opportunities FVA Specific Assessment
► Feasible and effective mitigation options were modelled ► Mitigation reduces vulnerability by a measurable amount (reduced
flood score i.e. reduced risk)
► Example:
► Short-List Alternatives
1. Upgrade selected culverts 2. Upgrade culverts and improve channel 3. Acquire property to facilitate larger culvert upgrades and wider channel
54
Flood Mitigation Opportunities Cost Benefit & Prioritization
► A relative “cost-benefit” can be calculated and used to prioritize the
most “effective” solutions
► Cost - Capital $ ► Benefit – Reduction in flood vulnerability
► Example:
55
Option ΔFlood Score Capital Cost Relative Cost-Benefit
Upgrade culverts
$2.4M 1.6
Upgrade culverts + channel
$7.3M 2.5
Acquire property + upgrade channel + upgrade culverts
$14.8M 1.3
City-Wide Recommended Flood Mitigation
► Eleven (11) capital projects were advanced
► Eight (8) culvert upgrades ► 800 m of channel conveyance improvements ► Two (2) major flood control facilities
► > 300 homes – reduced or eliminated flood risk
56
57
58
Creek Maintenance – Additional funds for improved level of service
► Recognition of watercourses as ‘natural infrastructure’ – need to
maintain conveyance capacity
► $100,000 additional base budget funding ► Enhanced level of service ► Bi-annual creek debris inspection program ► New equipment to assist debris cleanup in areas with access
challenges
► Rural ditch maintenance program
Data Collection / Management / Forms
efficient use of resources and prevent duplication of effort
Authority/Region)
59
Lack of Contemporary Analytical Tools
present) in multiple platforms
GAWSER, HSP-F
assessment and planning tools; considerations include:
60
► Design Standards
i.
Short duration thunderstorms can produce peak flows comparable to longer duration post-tropical events (Regional Storm)
ii.
Regional Storm remains an appropriate basis for flood hazard planning in the City of Burlington
iii.
Functioning major overland flow route is critical to conveying flows from extreme storm water runoff events - this was not a design standard prior to 1977, upgrading older areas of the city to this standard is a challenge – the piped system (storm sewers ) cannot be relied on to provide flood protection
iv.
Lot grading and drainage around the building foundation is critical: largely on private property and easily compromised over time by homeowners if not aware of the importance.
v.
Owners of older homes are best advised to understand the limits and flooding risk associated with their basements – many steps can be take to mitigate the losses in the event of flooding
61
62
common hydrologic/hydraulic platform
upgrades, floodplain mapping, post-storm analysis, etc)
63
City of Burlington Study Recommendations
► Include $20.04M in storm water infrastructure improvements for
consideration in the 2016 Capital Budget and 2017-2025 Capital Forecast.
► Majority of the Capital Improvements relate to Improvements to Riverine
Flood Hazard through either Channel Upgrades, Bridge Upgrades or Flood Storage.
► Need to increase funding to maintenance activities and pond renewal
has been identified.
► Review viability of a Storm Water User Fee as a long term sustainable
funding mechanism
► Increased Public Education & Outreach on Flood Risk and Mitigation
Opportunities.
64
6 Home Adaptation Assessment Program
(HAAP)
flooding
mitigation programs across the globe Educating Homeowners
municipalities and insurance companies
7Shared Funding Model
government and insurance companies
Technical Aspects of Assessment
and 12 months
8