
SLIDE 1
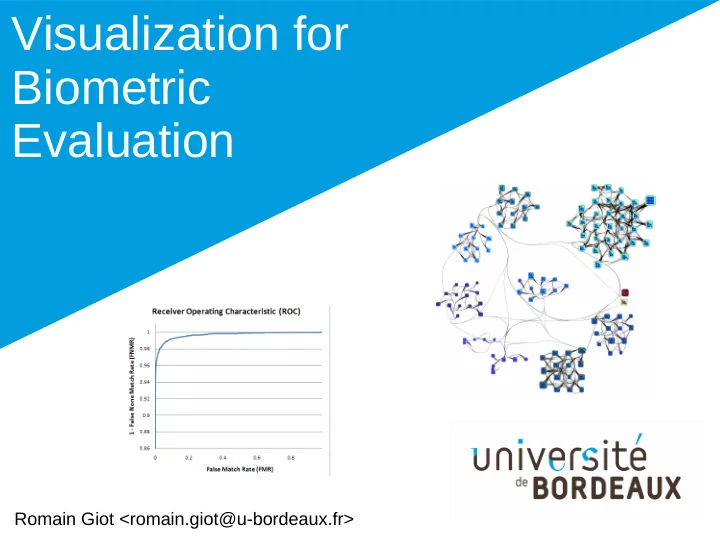
Visualization for Biometric Evaluation
Romain Giot <romain.giot@u-bordeaux.fr>
Romain Giot <romain.giot@u-bordeaux.fr>
Visualization for Biometric Evaluation Romain Giot - - PowerPoint PPT Presentation
Visualization for Biometric Evaluation Romain Giot <romain.giot@u-bordeaux.fr> Romain Giot <romain.giot@u-bordeaux.fr> Introduction Who am I ? Work place University of Bordeaux IUT Bordeaux Computer Science
Romain Giot <romain.giot@u-bordeaux.fr>
Romain Giot <romain.giot@u-bordeaux.fr>
– University of Bordeaux
– Laboratoire Bordelais de
Recherche en Informatique
– Biometric authentication
multibiometrics, template update
– Large graph visualization
– Common visual tools used to evaluate biometric
– Novel one which focus on other aspects
1801 1786
– Entities – Relations (between entities)
– Quantitative
– Ordinal
– Categorical/Nominal
http://www.fusioncharts.com/
– Color & density
– Position, length,
[Mackinley]
[Mackinley]
low medium high
http://www.fusioncharts.com/
[Elmqvist2008]
The Nested Blocks and Guidelines Model. Miriah Meyer, Michael Sedlmair, P. Samuel Quinan, and Tamara Munzner.Information Visualization 14(3), Special Issue on Visualization Evaluation (BELIV)
– Use of biometric data – Very hard to share (better than a password) – Vary hard to be stolen or lost (better than a token)
– Physiological: face recognition, iris recognition, voice
– Behavioral: keystroke & mouse dynamics, voice
Presentation
biometric sample(s) Computation of the biometric reference sample(s) Storage reference Presentation
biometric sample Computation of the biometric score sample Reference of claimed individual score Comparison to the decision threshold User is rejected User is accepted Score strictly below to threshold Score higher than threshold
Enrollment Verification
Presentation
biometric samples Computation of the biometric reference sample(s) Storage reference Presentation
biometric samples Presentation
biometric samples Computation of the biometric score sample reference score Comparison to decision threshold User is rejected User is accepted Score below to threshold Score higher than threshold
Enrollment Verification Failure to acquire False Match False Non Match Failure to acquire Failure to enroll
–
Gallery and Probe
–
Intrascores (|I|*|P|)
–
Interscores (|I|*|I|*|P|)
–
False Non Match Rate
–
False Match Rate
–
Equal Error Rate
|I|
–
Gallery and Probe
–
Intrascores (|I|*|P|)
–
Interscores (|I|*|I|*|P|)
–
False Non Match Rate
–
False Match Rate
–
Equal Error Rate
|I| |P|
–
Gallery and Probe
–
Intrascores (|I|*|P|)
–
Interscores (|I|*|I|*|P|)
–
False Non Match Rate
–
False Match Rate
–
Equal Error Rate
– Receiver Operating Characteristic (ROC) – Detection Error Trade-off (DET) – Expected Performance Curve (EPC)
– Scores distribution – Zoo plot
[Poh et al. 2012]
[Anzar et al. 2013]
http://biometrics.derawi.com/?page_id=51
[Chul Lee 2011]
[Schukers 2010]
[Bengio et al. 2005]
[Yager 2010]
data: List of FNMR, FMR per threshold How perform the system depending on decision threshold ? What is the individual classification ? data: List of averaged genuine and impersonation scores per individual Scatter plot How the system generalizes
datasets ? Line chart data: List of error rates depending
Line chart Zoo plot EPC FMR/FNMR curve DET curve ROC curve X = FMR Y = 1-FNMR X = FMR Y = 1-FNMR log-scale X = thershold Y = FMR/FNMR X = genuine score Y = impostor score X = threshold Y = error rate
– Global information – => problematic threshold configuration can be identified – => Impossible to identify the problematic individuals
– Individual information – => BUT screen space not well used – Possible to identify the problematic individuals – => BUT impossibility to understand why
– Allows to see generalization on other datasets – Hard to read and understand
– Lack of information to understand the reasons of failures
– Some are exact [Fawcett 2006] (and fast) – Most are inexact (and probably slower)
– So most of ROC curves are partly lying on the results
– Easily track the problematic individuals – Easily track the impersonating relations between
– Zooplot shows problematic individuals – But not relations between them
– Provide space equally for individuals
[Giot et al. 2016]
– The non-linear mapping of individuals position reduces
– The edges as well as the nodes size highlight the bad
– Does not scale well when there are more than 10% of
– Edges are computed on averaged scores => the drawing
– Easily track the problematic individuals – AND easily track the problematic samples – Easily track the impersonating relations between
– Enhance Zoo Graph by displaying the samples – Cluster the individuals based on their biometric behavior – Use graph layout methods instead of an ad hoc
[Giot et al. 2017]
– Inability to be verified
– Ability to impersonate
– Ratio of impersonation
– FMR
– FNMR
– Clear identification of problematic samples – Clear identification of different individual behaviors
– Huge drawing size => interaction is mandatory – More complex to handle than standard methods – The display is CPU/GPU intensive and does not parallel
– ROC curve visualization can be improved (addition of score
distribution)
– No visualization targets spoofing attacks – No visualization targets user behavior in template update systems
– The cognitive effort to understand them is far more important than
for the ROC curve
– The computational power needed to compute them is for more
important than for the ROC curve