
SLIDE 1
10 March 2020
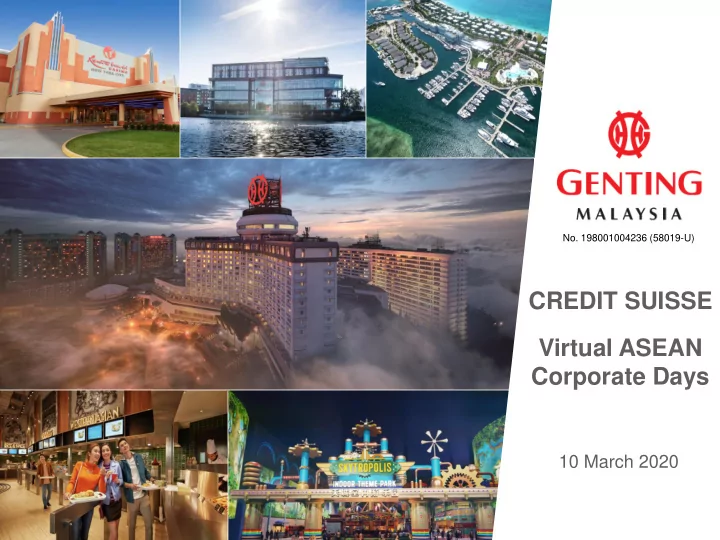
CREDIT SUISSE Virtual ASEAN Corporate Days
- No. 198001004236 (58019-U)
Virtual ASEAN Corporate Days 10 March 2020 AGENDA 1 GROUP - - PowerPoint PPT Presentation
No. 198001004236 (58019-U) CREDIT SUISSE Virtual ASEAN Corporate Days 10 March 2020 AGENDA 1 GROUP OVERVIEW 2 FINANCIAL HIGHLIGHTS 3 MALAYSIAN OPERATIONS OVERSEAS OPERATIONS 4 - UK & EGYPT - US & BAHAMAS LOOKING AHEAD 5 2
10 March 2020
CREDIT SUISSE Virtual ASEAN Corporate Days
2
1 GROUP OVERVIEW 2 FINANCIAL HIGHLIGHTS 3 MALAYSIAN OPERATIONS 4 OVERSEAS OPERATIONS
5 LOOKING AHEAD
3
4 * Genting Malaysia Berhad is a 49.5% owned subsidiary of Genting Berhad
Malaysia
100% 100% 100% 100% 78% 100% 100%
US & Bahamas UK & Egypt
*
49%
5 Resorts World Casino New York City, US Resorts World Bimini, Bahamas Resorts World Genting, Malaysia Resorts World Birmingham, UK Resorts World Catskills, US
Resorts World Genting
Genting UK
6
Resorts World Casino New York City
Resorts World Catskills
Resorts World Bimini
7
8
In RM’mil 4Q19 4Q18 % Change FY19 FY18 % Change
Revenue 2,442 2,507 ↓3% 10,407 9,928 ↑5% Adjusted EBITDA 551 749 ↓26% 2,641 2,873 ↓8%
Adjusted EBITDA Margin 23% 30% 25% 29%
Net Profit
(Excl. Mashpee impairment)
282 705 ↓60% 1,332 1,748 ↓24% Net Profit 282 705 ↓60% 1,332 (86) ↑>100%
9
Malaysia 67% UK & Egypt 17% US & Bahamas 16% Malaysia 78% UK & Egypt 11% US & Bahamas 11%
REVENUE & ADJUSTED EBITDA
Malaysia 69% UK & Egypt 16% US & Bahamas 15% Malaysia 80% UK & Egypt 9% US & Bahamas 11%
Revenue Adjusted EBITDA 4Q19 FY19 Revenue Adjusted EBITDA
6.50 7.10 16.50 17.00 19.00 20.00*
8 12 16 20 24 FY14 FY15 FY16 FY17 FY18 FY19
Dividend per Share
10
Dividend
Net dividend per share (sen)
*Include a special dividend of 9.0 sen (FY18: 8.0 sen) per share
9.20 7.30 9.00 8.00
Share Buyback
11.00 8.00
CAPITAL MANAGEMENT
9.00 11.00
#Based on closing price @ 31 Dec 2019
11
12
In RM’mil 4Q19 4Q18 % Change FY19 FY18 % Change Revenue 1,604.8 1,698.6 ↓6% 7,066.6 6,594.6 ↑7% Adjusted EBITDA 415.1 582.2 ↓29% 2,048.2 2,297.3 ↓11% Adjusted EBITDA Margin 26% 34% 29% 35%
5,362 5,577 5,623 5,837 6,595 7,067
3,000 4,500 6,000 7,500 FY14 FY15 FY16 FY17 FY18 FY19
13
Revenue (RM’mil)
1,972 1,860 1,931 1,942 1,806 2,297 2,048 35% 35% 35% 35% 31% 35% 29% 0% 5% 10% 15% 20% 25% 30% 35%
1,000 1,500 2,000 2,500 3,000 FY13 FY14 FY15 FY16 FY17 FY18 FY19
14
cost structure
Adjusted EBITDA (RM’mil) / Margin (%)
15
FY18 FY19
VISITORS
(FY17: 23.6m)
VISITORS
(FY17 : 4.2mil)
MEMBERS
MEMBERS
16
across 7 hotels FY18 FY19
AVG ROOM RATE
AVRG ROOM RATE
(FY17: RM92)
OCCUPANCY
(FY17: 95%)
OCCUPANCY
17
UK US & Bahamas Egypt
18
– UNITED KINGDOM & EGYPT
19
In £’mil 4Q19 4Q18 % Change FY19 FY18 % Change Revenue 78.8 79.2 ↓1% 316.8 330.1 ↓4% Adjusted EBITDA 11.2 11.5 ↓3% 43.8 33.8 ↑29%
Adjusted EBITDA Margin 14% 15% 14% 10%
standard
20
– US & BAHAMAS
In US$’mil 4Q19 4Q18 % Change FY19 FY18 % Change Revenue* RWNYC and RW Omni 84.6 78.3 ↑8% 332.8 319.0 ↑4% RW Bimini 3.9 3.6 ↑8% 21.8 24.1 ↓10% Total 88.5 81.9 ↑8% 354.6 343.1 ↑3% Adjusted EBITDA* RWNYC and RW Omni 21.0 26.3 ↓20% 88.5 103.9 ↓15% RW Bimini (5.3) (4.0) ↓33% (18.8) (28.2) ↑33% Total 15.7 22.3 ↓30% 69.7 75.7 ↓8%
Margin 18% 27% 20% 22%
21
22
……Transforming RWNYC into a premium integrated resort destination
dining, entertainment and retail outlets
Artist Impression
23
…...Premium destination resort offering unparalleled entertainment
Artist Impression
and various F&B outlets
24
25
Resorts World Genting
theme park
and international tourism recovers
segments
26
UK & Egypt
revamped
interactive business to enhance offline and online gaming experiences
27
US & Bahamas
– Focus on RWNYC’s ongoing expansion – Leverage synergies between RWNYC and RW Catskills to grow business volume and improve margins
– Leverage Hilton Miami Downtown to drive visitation and revenue
– Improve accessibility and infrastructure – Leverage partnerships with renowned brands to improve footfall and revenue
28
Disclaimer Some of the statements made in this presentation which are not statements of historical facts are forward-looking statements and are based on the current beliefs, assumptions, expectations, estimates, objectives and projections of the directors and management of the Genting Malaysia Group (“Group”) about its business and the industry and markets in which it operates. These statements are not guarantees of future performance and are subject to risks, uncertainties and other factors some
materially from those expressed or forecast in the forward looking statements as a result of, among other factors, changes in economic and market conditions, changes in the regulatory environment and other business and operational
may arise after publication.