Vi t Virtual Neurons l N 3D reconstructions of neurons - - PowerPoint PPT Presentation

vi t virtual neurons l n
SMART_READER_LITE
LIVE PREVIEW

Vi t Virtual Neurons l N 3D reconstructions of neurons - - PowerPoint PPT Presentation

Vi t Virtual Neurons l N 3D reconstructions of neurons 3D-reconstructions of neurons Manos Papadakis p University of Houston Collaborators I. Kakadiaris, I. Kakadiaris, D. Labate Neuroscience/data acquisition collaborators: q P. Saggau


slide-1
SLIDE 1

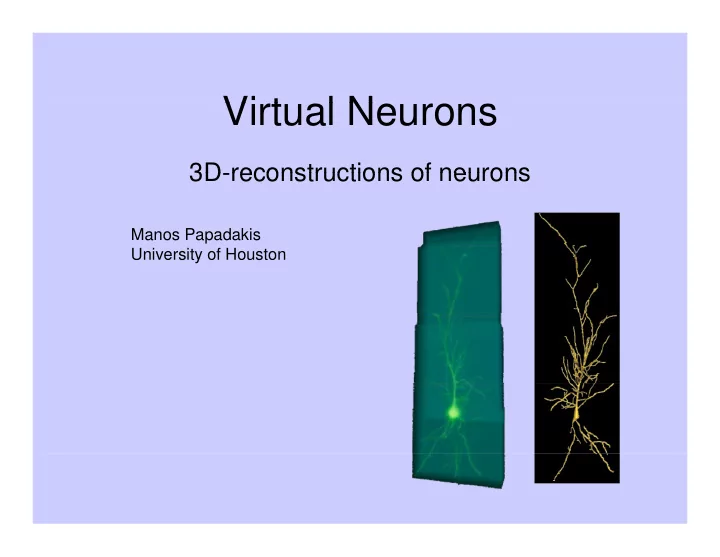
Vi t l N Virtual Neurons

3D reconstructions of neurons 3D-reconstructions of neurons

Manos Papadakis p University of Houston

slide-2
SLIDE 2

Collaborators

  • I. Kakadiaris,
  • I. Kakadiaris,
  • D. Labate

Neuroscience/data acquisition collaborators: q

  • P. Saggau (BCM) and F. Laenza (UTMB)
  • D. Jimenez, P. Hernadez-Herrera and A. Santamaria-Pang
slide-3
SLIDE 3

Morphological reconstruction of i ifi neurons: significance

  • To understand the I/O relationship of individual central

p neurons – Combining detailed structural and functional information

Signal In Signal Out Structure and Function

3

slide-4
SLIDE 4

Image Analysis Goal: Image Analysis Goal:

  • Extract the geometric properties of dendritic arbors

g p p

  • Reconstruct a computer-generated 3D-image of the arbor.

Do the last task when a neuron is activated and responds. This will help add a layer of a true This will help add a layer of a true activation/response model.

4

Raw Data Reconstruction

slide-5
SLIDE 5

Characteristics of the dendritic structure

– Global features (e.g., branch size, shape, and tapering; branch bifurcations; overall geometry, distribution of the shape of ; g y, p spines) – Local features (e.g., the dendritic spines)

5

slide-6
SLIDE 6

Challenges (1) Challenges (1)

  • Uneven distribution of the fluorescent dye.

D th d d t i t it h d tt i

30 m

  • Depth-dependent intensity changes and scattering

5 m 10 m i i t it j ti

6

x –y maximum intensity projection y –z maximum intensity projection

slide-7
SLIDE 7

Challenges (2) Challenges (2)

  • Irregular shape of the dendrites

g p

  • Adjoining structures: spines
  • Many features of interest are at the resolution limit of

light microscopy

2 m Tubular-like 2 2 m 2 m

7

slide-8
SLIDE 8

Challenges (3) Challenges (3)

  • Low signal to noise ratio: thermal noise, photon shot

g , p noise

  • Different noise model (Poisson) from CT or MRI
  • Different noise model (Poisson) from CT or MRI

(Gaussian)

8

slide-9
SLIDE 9

ORION 1 Morphological Reconstruction Pi li Pipeline

Input: Raw data Step 3 Dendrite Detection Step 2. Denoising Step 1. Deconvolution Step 3. Dendrite Detection

Shape learning and shape prediction 3D Frame-Based Denoising

p g

Experimental PSF

Step eco

  • ut o

Shape Model Shape Model

Multiple image stacks registration

Step 4. Registration

Medial axis and

Step 5. Morphological Reconstruction Step 6. Statistical analysis Output: Simulation of Computational Model

stacks registration radius estimation Hoc file generation

9

slide-10
SLIDE 10

Dendrite Detection: Shape Features

  • Filter the 3D-image I with

Gaussian kernels Gσ for different

σ

σ.

  • Extract the Hessian of I* Gσ (x)

Find the eigenvalues of I* G

  • Find the eigenvalues of I* Gσ

(x). These are the shape features.

5 m

These are the shape features.

  • Classification of voxels according

to the learned features.

10

slide-11
SLIDE 11

Dendrite Detection: Learning from Examples

Shape p Learning

Model to Learn Data to predict Prediction

11

slide-12
SLIDE 12

Dendrite Detection: Comparisons

Original Data Orion 1 Original Data Orion 1

12

Frangi Sato

slide-13
SLIDE 13

Results (2) Results (2)

Medium Poor

13

slide-14
SLIDE 14

Results (3) Results (3)

14

slide-15
SLIDE 15

O i 1 R t ti f Di d D t S t 1 Orion 1 Reconstruction for Diadem Data Set 1

Volume 1: CF1 Volume 2: CF2

slide-16
SLIDE 16

Orion 1 Reconstruction for Diadem Data Set 5 Orion 1 Reconstruction for Diadem Data Set 5

Volume 1: OP1 Volume 3: OP3

slide-17
SLIDE 17

Orion 1 Reconstruction for Diadem Data Set 2 Orion 1 Reconstruction for Diadem Data Set 2

Raw data Prediction Raw data Prediction

slide-18
SLIDE 18

Synthetic data volumes

  • Synthetic data volumes can be used for benchmarking

imaging algorithms in neuroscience.

  • These algorithms aim to extract the geometric

characteristics of a neuron from the input 3D-image.

  • Benchmarking of their performance must be done under
  • Benchmarking of their performance must be done under

ideal conditions where the ground truth is precisely known.

  • Neurons can be modeled as tubular structures.
slide-19
SLIDE 19
slide-20
SLIDE 20
slide-21
SLIDE 21
slide-22
SLIDE 22
slide-23
SLIDE 23
  • r
  • r
slide-24
SLIDE 24
slide-25
SLIDE 25
slide-26
SLIDE 26
  • Is it true that if Φα is radial then a greedy algorithm selection of Λ for f is not

influenced by the rotations of f ?

  • What happens with other orthogonal transform groups and other norms,

S b l ? e.g. Sobolev norms?

slide-27
SLIDE 27

Changing resolution/superesolution resolution/superesolution

Changing resolution in images or creating crisp images from a series of low-resolution images is significant in from a series of low resolution images is significant in forensic science and biometrics. Artifacts/errors must not depend on the orientation of singularities singularities.

slide-28
SLIDE 28
slide-29
SLIDE 29
slide-30
SLIDE 30

Isotropic Re-sampling

We wish to take a super-resolution or a sub-resolution using the IMRA framework. Thi i t t i f ti i i t i – This is meant to preserve information in an isotropic fashion, i.e., without directional bias. – Preliminary results show promise for optimal Preliminary results show promise for optimal performance, particularly for super-resolution, using an IMRA setting.

800 x 800 400 x 400

slide-31
SLIDE 31

Isotropic Down-sampling Isotropic Down sampling

  • Down-sampling in an IMRA framework for

Down sampling in an IMRA framework for 15 degree rotation of a line e.g.,

slide-32
SLIDE 32

Isotropic Down-sampling Isotropic Down sampling

  • Down-sampling in an IMRA framework for

Down sampling in an IMRA framework for 45 degree rotation of a line e.g.,

slide-33
SLIDE 33

Isotropic Up-sampling Isotropic Up sampling

  • Up-sampling in an IMRA framework for 15

Up sampling in an IMRA framework for 15 degree rotation of a line e.g.,

slide-34
SLIDE 34

Isotropic Up-sampling Isotropic Up sampling

  • Up-sampling in an IMRA framework for 45

Up sampling in an IMRA framework for 45 degree rotation of a line e.g.,

slide-35
SLIDE 35

Examples of synthetic dendrites

Cylinder along the x-axis for sanity check

Second downsampling Third downsampling Second downsampling Third downsampling

slide-36
SLIDE 36

Examples of synthetic dendrites

  • Cross section 30⁰
  • Cross section 45⁰
  • Cross section 90⁰
  • Cross section 30⁰
  • Cross section 45⁰
  • Cross section 90⁰
slide-37
SLIDE 37

Examples of synthetic dendrites

  • Slices at 30 ⁰, 45 ⁰, and 90 ⁰
slide-38
SLIDE 38

Examples of synthetic dendrites

slide-39
SLIDE 39

Thank you for attending I thank the organizers for this wonderful meeting. Thank the weather for the NFFFT 2011 NFFFT 2011