vertical arrangements and competition evidence from
play

Vertical Arrangements and Competition: Evidence from Electricity - PDF document

Vertical Arrangements and Competition: Evidence from Electricity Markets Jim Bushnell, UC Energy Institute www.ucei.berkeley.edu Presentation based upon Vertical Arrangements, Market Structure and Competition: An Analysis of US Restructured


  1. Vertical Arrangements and Competition: Evidence from Electricity Markets Jim Bushnell, UC Energy Institute www.ucei.berkeley.edu Presentation based upon “Vertical Arrangements, Market Structure and Competition: An Analysis of US Restructured Electricity Markets” with Erin Mansur and Celeste Saravia Outline • Motivation – How do different market attributes interact in determining market competitiveness? • Punchline – By traditional measures of horizontal market structure, California should have been the most competitive, not the least – vertical relationships played a key role in the “successful” markets • General implications • The details of the empirical study • conclusions 2 
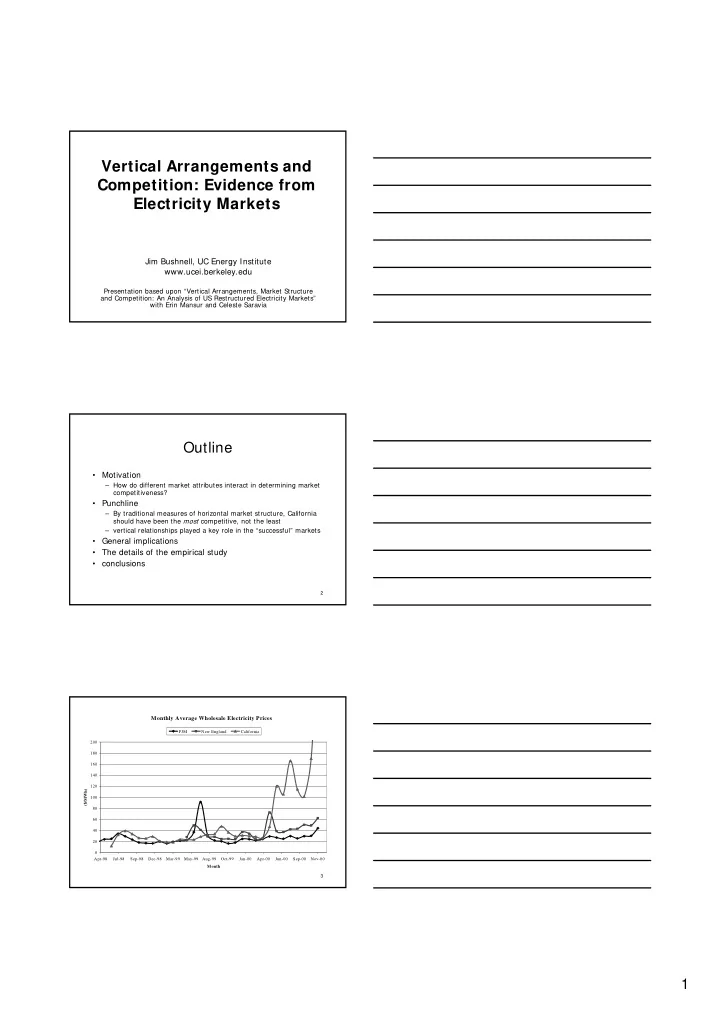
Monthly Average Wholesale Electricity Prices PJM New England California 200 180 160 140 120 ($/MWh) 100 80 60 40 20 0 Apr-98 Jul-98 Sep-98 Dec-98 Mar-99 May-99 Aug-99 Oct-99 Jan-00 Apr-00 Jun-00 Sep-00 Nov-00 Month 3 1

  2. The Challenge of Competitive Electricity Markets • Lack of price-responsive demand • Costly storage • Frequently binding capacity constraints, long construction lead-times – Transmission – Generation • Even firms with small market shares can enjoy substantial market power under the right (wrong) circumstances 4 New England Energy Clearing Price and MC Energy Clearing Price Competitive Price 180 160 140 120 ($/MWh) 100 80 60 40 20 0 Feb-99 May-99 Aug-99 Dec-99 Mar-00 Jun-00 Oct-00 Jan-01 Apr-01 Jul-01 Month 5 Average California PX price and MC PX price Competitive Price 180.00 160.00 140.00 120.00 ($/MWh) 100.00 80.00 60.00 40.00 20.00 0.00 Apr-98 Jul-98 Nov-98 Feb-99 May-99 Aug-99 Dec-99 Mar-00 Jun-00 Oct-00 Jan-01 Month 6 2

  3. Kernel Regressions of Lerner Index vs. Capacity Ration (May - December 1999) New England California PJM 1 0.9 0.8 0.7 0.6 (p-MC)/p 0.5 0.4 0.3 0.2 0.1 0 0 0.1 0.2 0.3 0.4 0.5 0.6 0.7 0.8 0.9 1 Residual Demand/ Capacity 7 Kernel Regressions of Lerner Index vs. Capacity Ration (May - October 2000) New England California PJM 1 0.9 0.8 0.7 0.6 (p-MC)/p 0.5 0.4 0.3 0.2 0.1 0 0 0.1 0.2 0.3 0.4 0.5 0.6 0.7 0.8 0.9 1 Residual Demand/ Capacity 8 Market Comparisons • Markets have experienced very different levels of prices – Counter-factual competitive prices can tell us the degree price exceeds these levels: • Borenstein, Bushnell, and Wolak and Joskow and Kahn on California • Bushnell and Saravia on New England • Mansur on PJM • But why have they performed differently? 9 3

  4. Forward Commitments and Oligopoly • Forward contracts increase spot production – Less incentive to raise spot prices if most sales are already locked up under fixed-price contracts • Desire to capture market from competition leads to equilibrium forward contracting by all firms – more output by all firms relative to when there is no forward market • Pushing market forward allows for more supply and demand response – More potential suppliers 10 Vertical structure and forward commitments • Usually we think of wholesale (upstream) price determining the (downstream) retail price – Issues are usually foreclosure, raising rivals costs vs. double marginalization • In some markets, retailers make forward commitments to customers – utilities – telecom services – construction • In these markets a vertical arrangement plays the same role as a forward contract – a pro-competitive effect – A balanced generator-retailer does not have a big net position in the wholesale market 11 Retail and Generation in Great Britain, 2006 100% Others Others 90% Scottish Power Scottish Power London (EdF) 80% London (EdF) 70% Scottish & Southern Energy Scottish & Southern Energy 60% AES 50% PowerGen PowerGen BNFL 40% Centrica (British Gas) Centrica (British Gas) 30% British Energy British Energy 20% 10% Innogy (Npower) Innogy (Npower) 0% Retail Generation 12 4

  5. Retail and Generation in New Zealand, 2004 100% Other Trustpower 90% Other Mighty River 80% Trustpower 70% Genesis Mighty River 60% 50% Genesis Contact 40% 30% Contact 20% Meridian Meridian 10% 0% Retail Generation 13 Retail and Generation in Spain, 2004 100% 90% Other Other 80% Hidrocantabrico Union Fenosa 70% Hidrocantabrico 60% Union Fenosa Iberdrola 50% 40% Iberdrola 30% 20% Endesa Endesa 10% 0% Retail Generation 14 Retail and Generation in PJM, 1999 100% Other 90% Baltimore Gas & Electric Other 80% Potomac Electric Power 70% Baltimore Gas & Electric PP&L Inc. 60% Potomac Electric Power 50% PECO Energy PP&L Inc. 40% PECO Energy 30% Public Service Electric & Gas Public Service Electric & Gas 20% 10% GPU Inc. GPU Inc. 0% Retail Generation 15 5

  6. Retail and Generation in New England 1999 100% 90% Other 80% Other 70% 60% Wisvest FP&L Energy 50% Sithe Mirant PG&E N.E.G. 40% PG&E N.E.G. 30% 20% Northeast Util. Northeast Util. 10% 0% Retail Generation 16 Retail and Generation in California 1999 100% 90% Other Other 80% 70% 60% SCE Dynegy/NRG Duke 50% Mirant 40% Reliant 30% AES/Williams SCE 20% PG&E 10% PG&E 0% Retail Generation 17 18 6

  7. Market Comparisons • Role of Vertical Arrangements – Almost no policy discussion of impact of retail policies on vertical arrangements like long term contracts and vertical integration. • California required divestiture and prohibited long term contracts (foreclosure concerns) • New England required “vesting” contracts • PJM firms remained vertically integrated in generation, transmission, and distribution – We ask: what is the relative influence of market rules, horizontal structure, and vertical arrangements on market performance 19 Approach • abstract away from specific market rules and establish bounds on the potential scope of impact of those rules • Bounds are established by horizontal structure and vertical arrangements 20 Supply Function Equilibrium Green and Newbery (1992) 21 7

  8. Green and Newbery (1992) $ Cournot D max D min competitive Q 0 22 Bounds on Non-Cooperative Outcomes $ Cournot D max Bound on NC D min Equilibrium outcomes competitive 0 Q supplied 23 Retail Obligations/Contracts Reduce Bounds $ D max Cournot Bound on NC D min Equilibrium outcomes competitive 0 Q supplied Contract Q 24 8

  9. Methodology • Data on spot price, quantity demanded, vertical commitments, and unit-specific marginal costs. • Estimate supply of fringe firms. – Calculate residual demand. • Simulate market outcomes under: – 1. Price taking behavior: P = C’ – 2. Cournot behavior: P + P’ * q = C’ – 3. Cournot behavior with vertical arraignments: P + P’ * (q-q c ) = C’ 25 Residual Demand function • Source of “residual demand” price elasticity in model • We observe import quantities, market price, and weather conditions in neighboring states α = + β actual actual Q ln( p ) t t t ⎛ α − ⎞ Q = ⎜ t t ⎟ p exp t β ⎝ ⎠ • The demand curve is fit through the observed price and quantity outcomes. Estimates of price responsiveness are greatest in California ( β≈ 5400) • relative to New England ( β≈ 1180) and PJM ( β≈ 860). 26 27 9

  10. 28 29 30 10

  11. 31 Price comparison on peak Price New England California PJM Actual 43 55 97 Competitive 35 39 35 Cournot 45 53 87 Cournot Same 246 1000 (“n.v.a.”) 32 Price comparison off peak Price New England California PJM Actual 24 29 24 Competitive 26 31 25 Cournot 30 31 33 Cournot Same 98 901 (“n.v.a.”) 33 11

  12. Conclusions • Horizontal structure alone does a very poor job describing the performance of US markets • Vertical arrangements + horizontal structure massively reduces scope for market rules to impact outcomes, appear to explain performance pretty well • Vertical arrangements are having a big impact on competition, market rules less so • Key was that retail prices were constrained, making them similar to long-term fixed price contracts – In this case by regulatory transition mechanisms – A similar effect could apply for deregulated retail if retail prices are determined before wholesale prices 34 12

Download Presentation
Download Policy: The content available on the website is offered to you 'AS IS' for your personal information and use only. It cannot be commercialized, licensed, or distributed on other websites without prior consent from the author. To download a presentation, simply click this link. If you encounter any difficulties during the download process, it's possible that the publisher has removed the file from their server.

Recommend


More recommend