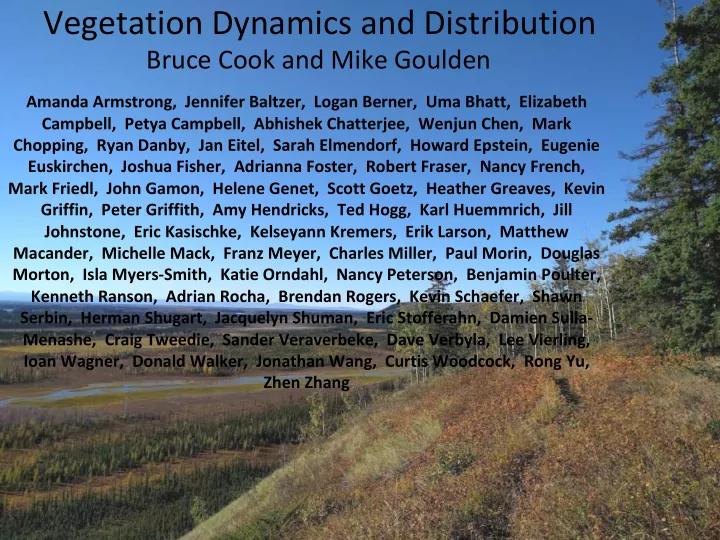

Vegetation Dynamics and Distribution Bruce Cook and Mike Goulden Amanda Armstrong, Jennifer Baltzer, Logan Berner, Uma Bhatt, Elizabeth Campbell, Petya Campbell, Abhishek Chatterjee, Wenjun Chen, Mark Chopping, Ryan Danby, Jan Eitel, Sarah Elmendorf, Howard Epstein, Eugenie Euskirchen, Joshua Fisher, Adrianna Foster, Robert Fraser, Nancy French, Mark Friedl, John Gamon, Helene Genet, Scott Goetz, Heather Greaves, Kevin Griffin, Peter Griffith, Amy Hendricks, Ted Hogg, Karl Huemmrich, Jill Johnstone, Eric Kasischke, Kelseyann Kremers, Erik Larson, Matthew Macander, Michelle Mack, Franz Meyer, Charles Miller, Paul Morin, Douglas Morton, Isla Myers-Smith, Katie Orndahl, Nancy Peterson, Benjamin Poulter, Kenneth Ranson, Adrian Rocha, Brendan Rogers, Kevin Schaefer, Shawn Serbin, Herman Shugart, Jacquelyn Shuman, Eric Stofferahn, Damien Sulla- Menashe, Craig Tweedie, Sander Veraverbeke, Dave Verbyla, Lee Vierling, Ioan Wagner, Donald Walker, Jonathan Wang, Curtis Woodcock, Rong Yu, Zhen Zhang above.nasa.gov @NASA_ABoVE
Working Group overview • Very large working group – lots of cross membership w/ other WGs (C + Veg; Fire + Veg; Water + Veg; Wildlife + Veg) • WG Goal to facilitate communication – spread science results, ideas and approaches within working group – learn about parallel or complementary projects - science focused telcons every ~3 months • As Phase 1 winds down, target 3-5 “summary”, “synthesis” or “consensus” subgroups/papers – multiple individual teams join to discuss areas of agreement and disagreement – goal is to distill, clarify and communicate “big picture” findings to Phase 2, as well as the broader community including stake holders 2 above.nasa.gov @NASA_ABoVE
Breakout agenda/charge • Identify 3-5 candidate areas for synthesis – focus on areas where there has been significant progress in ABoVE (and the broader research community), where multiple teams in ABoVE have been working in parallel on similar themes, where the “time is right”, and where there’s a commitment • Discuss each area – identify 2-3 science punchlines per area – gauge enthusiasm and possible commitment • Goals for today – list of candidate synthesis areas – start to identify punchlines, key datasets/approaches/papers – identify interested people and a champion - but be realistic • Goals for year – minimum is flesh out today’s goals – maximum is a synthesis manuscript 3 above.nasa.gov @NASA_ABoVE
Synthesis ideas from group • Tundra greening/browning - Approx half dozen groups; emphasis on mapping/identifying shrub density and structure; shrub demography mechanisms; field work such as fine scale remote sensing w/ drones. • Boreal forest greening/browning – Approx half dozen groups; emphasis on longer-term patterns especially using Landsat; key challenge separating fire signal; stress and dieback mechanisms. • Mapping disturbance and recovery – Several groups in Veg and more in other WGs – still coalescing wrt synthesis – emphasis on mapping disturbance history (fire, etc) – potential emphasis on recovery trajectories, including possible changes • Mapping vegetation type and change – Several groups in Veg and more in other WGs – still coalescing wrt synthesis – emphasis on mapping veg distribution – potential emphasis on mapping distribution change 4 above.nasa.gov @NASA_ABoVE
Boreal greening/browning punchlines 1. Boreal forest greening/browning originally identified in GIMMS NDVI record – how similar are Landsat, etc patterns? (ok, not great) 2. Fire and recovery during the satellite record create large positive or negative NDVI trends – how much of the broad browning/greening signal is caused by fire/fire recovery? (much is fire) 8000 7500 Landsat NDVI (*10000) 7000 2007 6500 Landsat NDVI recovery1985-1994 6000 Landsat NDVI recovery1995-2004 Landsat NDVI recovery2005-2016 5500 5000 4500 -20 0 20 40 60 Years since fire 2003 1964 1981 1956 1961 BOREAS NSA fires Landsat NDVI trend 5 above.nasa.gov @NASA_ABoVE
Boreal greening/browning punchlines 3. What is left after we remove the fire signal? What forest areas are browning (or greening) after we’ve controlled for fire? (browning more common near dry ecotones and greening near cold ecotones; wetland complexes; may also indicate missed fires and other disturbances) Damien Sulla- Menashe et al 6 above.nasa.gov @NASA_ABoVE
Working Group Cross Cuts • Tundra greening/browning – all other WGs – strong bidirectional interactions with hydrology/permafrost and biophysics – important for climate forcing and carbon - effects on wildlife – impact of increasing fire • Boreal forest greening/browning – all other WGs – strong bidirectional interactions with fire and hydrology/permafrost – important for climate forcing and carbon - impacts on wildlife • Mapping disturbance and recovery – all other WGs – also fits in fire WG – veg change effects on wildlife, carbon, hydrology • Mapping vegetation type and change – all other WGs, including some bidirectional interactions 7 above.nasa.gov @NASA_ABoVE
Recommend
More recommend