Nutrient loads from estuaries to the coastal ocean; the role of - - PowerPoint PPT Presentation

nutrient loads from estuaries to the coastal ocean the
SMART_READER_LITE
LIVE PREVIEW

Nutrient loads from estuaries to the coastal ocean; the role of - - PowerPoint PPT Presentation

Nutrient loads from estuaries to the coastal ocean; the role of resolution and vegetation on numerical estimates. Salme Cook, University of New Hampshire sc10@wildcats.unh.edu Resolution Vegetation


slide-1
SLIDE 1

Nutrient loads from estuaries to the coastal ocean; the role of resolution and vegetation on numerical estimates.

Salme Cook, University of New Hampshire

sc10@wildcats.unh.edu

Photo courtesy Cornell Cooperative Extension Marine Program

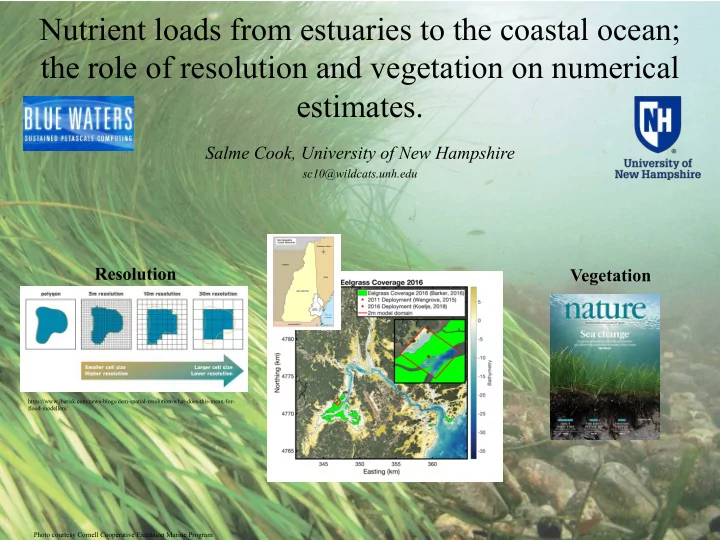
https://www.jbarisk.com/news-blogs/dem-spatial-resolution-what-does-this-mean-for- flood-modellers/

Resolution Vegetation

slide-2
SLIDE 2

Nutrient loads from estuaries to the coastal ocean; the role of resolution and vegetation on numerical estimates.

Estuary Coastal Ocean

Why does it matter?

slide-3
SLIDE 3

Nutrient loads from estuaries to the coastal ocean; the role of resolution and vegetation on numerical estimates.

“Nutrient pollution, defined as excess amounts of nitrogen and phosphorus in aquatic systems, is one of the leading causes of water quality impairment in the United States.” Why does it matter?

  • C. Lu and H. Tian (2017): Global nitrogen and phosphorus fertilizer use

for agriculture production

Agriculture Production Watershed Degradation Costs Global Cities $5.4 Billion in Water Treatment Annually

McDonald, R.I., Weber, K.F., Padowski, J., Boucher, T. & Shemie, D. (2016). Estimating watershed degradation over the last century and its impact on water-treatment costs for the world’s large cities. PNAS, 201605354.

slide-4
SLIDE 4

Nutrient loads from estuaries to the coastal ocean; the role of resolution and vegetation on numerical estimates.

Why does it matter?

slide-5
SLIDE 5

Nutrient loads from estuaries to the coastal ocean; the role of resolution and vegetation on numerical estimates.

Where my research fits in Why does it matter?

slide-6
SLIDE 6

Research Question:

Does sediment resuspension from mudflats significantly contribute to nutrient loading in estuaries? What is the relative importance of model resolution and the presence of subaquatic vegetation on the distribution of shear stress, and thereby sediment resuspension and nutrient loading, in these environments?

Numerical Modeling Observations Lab studies Ç√

slide-7
SLIDE 7

G u l f

  • f

M a i n e

EPA - National Estuary Program (NEP) Tidally dominant (1-2 m/s currents; 2-4 m tide range) Low river input (<2% of tidal prism) Tidal Channels with fringing mudflats

slide-8
SLIDE 8

Applied Shear stress Sediment Resuspension Nutrient/Pollut ant Release

Pore water Sediment

Function of sediment characteristics Where’s the mud? Function of hydrodynamics

Shear Stress and Nutrient Loading

Distance above bed (Z)

Modified from Nielsen (1992)

Velocity (Z)

**Need bay-wide estimates of shear stress**

>50% mud fraction 0.35 N/m2 for nutrient release Percuoco (2013)

Tides Waves

slide-9
SLIDE 9

9

Model Setup

Warner, J.C. et al (2009b) Warner, J.C. et al (2010)

Horizontal: 30 m, 10m* Vertical: 8 vertical sigma layers

C – Coupled O – Ocean (ROMS) A – Atmosphere (WRF) W – Wave (SWAN) ST – Sediment Transport

Regional Ocean Modeling System (ROMS)

  • Solves finite difference approx. of RANS equations
  • Written in F90/95, uses C-preprocessing to activate

different options. Output data is written into NetCDF files for post-processing.

22 km 25 km

slide-10
SLIDE 10

Numerical based estimates of bed shear stress

Classic Logarithmic “Law of the Wall” Formulation u v zob

SEDIMENT WATER

Lowest Water Cell High Tide Low Tide

slide-11
SLIDE 11
  • Initial Forcing

– Tide – OSU TPS output (M2, S2, N2, 01, K1)

  • Lateral Boundary Condition

– Closed (N,E,W) – Open on the Southern Edge (Rotated 53 degrees)

  • Bottom Boundary Condition

– Logarithmic drag law – zo = 0.02m*

  • Wetting and Drying

– Warner et al 2013

  • Data Output:

– 30 day run

– 30 minute average file - Shear Stress – 5 minute station data - model validation Model Setup : Configuration and Boundary Conditions

*Cook et al, 2019. Ocean Modelling.

Modified from Nielsen (1992)

slide-12
SLIDE 12

Low Tide

Numerical estimates of the distribution of bed shear stress

Where’s the mud?

>50% mud fraction 0.35 N/m2 for nutrient release Percuoco (2013)

slide-13
SLIDE 13

Low Tide Flooding Tide

Numerical estimates of the distribution of bed shear stress

Where’s the mud?

>50% mud fraction 0.35 N/m2 for nutrient release Percuoco (2013)

slide-14
SLIDE 14

Low Tide Flooding Tide High Tide

Numerical estimates of the distribution of bed shear stress

Where’s the mud?

>50% mud fraction 0.35 N/m2 for nutrient release Percuoco (2013)

slide-15
SLIDE 15

Numerical estimates of the distribution of bed shear stress

slide-16
SLIDE 16

Application : Nutrient Loading

[Lippmann(2013) ; Poppe (2013) ; Humberston (2015)] [Percuoco et al. (2015); Wengrove et al. (2015)]

Lab Studies

Step 2: Area with shear stress > 0.35 N/m2 Step 3: Calculate Nutrient Load (across entire bay)

Model Output

Step 1: Area with > 50% mud fraction

Wengrove et al. (2015) made the first estimate of nutrient loading from sediments during tropical storm Irene What about a typical tidal cycle?

slide-17
SLIDE 17

Application : Nutrient Loading

Dissolved Inorganic Nitrogen (DIN) Phosphorus (P) (kg/month) (kg/month) River A (Fall, Sept-Nov) 1,200 70 (Winter, Dec-Feb) 3,700 92 (Spring, Mar-May) 17,000 720 (Summer, June-Aug) 1,300 120 Sediments (modeled) 747 267* (kg/event) (kg/event) Event (Storm-Irene) B 220 80* One Tidal Cycle (Average) 25 9* Neap Tide (Minimum) 13 5* Spring Tide (Maximum) 91 33*

A Oczkowski (2002) B Wengrove (2015) * Based on results from Percuoco (2013). Uptake not considered for Phosphorus.

How do tides compare to other sources?

slide-18
SLIDE 18

Dissolved Inorganic Nitrogen (DIN) Phosphorus (P) (kg/month) (kg/month) River A (Fall, Sept-Nov) 1,200 70 (Winter, Dec-Feb) 3,700 92 (Spring, Mar-May) 17,000 720 (Summer, June-Aug) 1,300 120 Sediments (modeled) 747 267* (kg/event) (kg/event) Event (Storm-Irene) B 220 80* One Tidal Cycle (Average) 25 9* Neap Tide (Minimum) 13 5* Spring Tide (Maximum) 91 33*

Application : Nutrient Loading

A Oczkowski (2002) B Wengrove (2015) * Based on results from Percuoco (2013). Uptake not considered for Phosphorus.

How do tides compare to other sources?

slide-19
SLIDE 19

Dissolved Inorganic Nitrogen (DIN) Phosphorus (P) (kg/month) (kg/month) River A (Fall, Sept-Nov) 1,200 70 (Winter, Dec-Feb) 3,700 92 (Spring, Mar-May) 17,000 720 (Summer, June-Aug) 1,300 120 Sediments (modeled) 747 267* (kg/event) (kg/event) Event (Storm-Irene) B 220 80* One Tidal Cycle (Average) 25 9* Neap Tide (Minimum) 13 5* Spring Tide (Maximum) 91 33*

Application : Nutrient Loading

A Oczkowski (2002) B Wengrove (2015) * Based on results from Percuoco (2013). Uptake not considered for Phosphorus.

How do tides compare to other sources?

Ok…. So what about resolution and vegetation?

slide-20
SLIDE 20

Future Work

[Beudin, 2017]

The role of vegetation

LONG TERM DATASET! Seagrass.net (1983 - present)

Habitat - nursery Dampens Currents Promotes Sedimentation Nutrient uptake

Presented at Woods Hole Oceanographic Institute (WHOI) in February, 2019

slide-21
SLIDE 21

A Oczkowski (2002) B Wengrove (2015) * Based on results from Percuoco (2013). Uptake not considered for Phosphorus.

Dissolved Inorganic Nitrogen (DIN) Phosphorus (P) (kg/month) (kg/month) River A (Fall, Sept-Nov) 1,200 70 (Winter, Dec-Feb) 3,700 92 (Spring, Mar-May) 17,000 720 (Summer, June-Aug) 1,300 120 Sediments (30m) 747 267* Sediments (10m) 719 257* Eelgrass included 614 219* (kg/event) (kg/event) Event (Storm-Irene) B 220 80* One Tidal Cycle (Average) 25 24 20 9* 9* 7* Neap Tide (Minimum) 13 9 10 5* 4* 3* Spring Tide (Maximum) 91 80 56 33* 28* 20*

The role of resolution and vegetation

slide-22
SLIDE 22

Dissolved Inorganic Nitrogen (DIN) Phosphorus (P) (kg/month) (kg/month) River A (Fall, Sept-Nov) 1,200 70 (Winter, Dec-Feb) 3,700 92 (Spring, Mar-May) 17,000 720 (Summer, June-Aug) 1,300 120 Sediments (30m) 747 267* Sediments (10m) 719 257* Eelgrass included 614 219* (kg/event) (kg/event) Event (Storm-Irene) B 220 80* One Tidal Cycle (Average) 25 24 20 9* 9* 7* Neap Tide (Minimum) 13 9 10 5* 4* 3* Spring Tide (Maximum) 91 80 56 33* 28* 20*

The role of resolution and vegetation

slide-23
SLIDE 23

Dissolved Inorganic Nitrogen (DIN) Phosphorus (P) (kg/month) (kg/month) River A (Fall, Sept-Nov) 1,200 70 (Winter, Dec-Feb) 3,700 92 (Spring, Mar-May) 17,000 720 (Summer, June-Aug) 1,300 120 Sediments (30m) 747 267* Sediments (10m) 719 257* Eelgrass included 614 219* (kg/event) (kg/event) Event (Storm-Irene) B 220 80* One Tidal Cycle (Average) 25 24 20 9* 9* 7* Neap Tide (Minimum) 13 9 10 5* 4* 3* Spring Tide (Maximum) 91 80 56 33* 28* 20*

The role of resolution and vegetation

slide-24
SLIDE 24

Research outcomes

  • Validated a high res ocean model (30m) and published a

paper in Ocean Modeling (Feb 14th, Cook et al 2019)

  • Vegetation is important for trapping sediment and

preventing legacy nutrient loading (paper in prep)

  • No real gain in using the 10m grid - great for

computational savings!

Blue waters was instrumental in taking our modeling research to the next level. UNH is growing its modeling group, and this fellowship allowed me to grow and open up funding and support for more students

slide-25
SLIDE 25

Fellowship Outcomes

  • AGU Ocean Sciences Conference, 2018
  • Ocean Modeling publication, 2019
  • COFDL talk at MIT-Woods Hole Oceanographic

Institute (MIT-WHOI), 2019

  • Two more publications, summer/fall 2019
  • Undergraduate mentorship, summer 2018-2019

Ongoing:

  • HPC shared knowledge with lab group
  • Shared data with local scientists
slide-26
SLIDE 26

Conference Goals

(key challenges, bucket list, etc.…)

  • Improve workflow

– 10-200 GB and 2 TB netCDF files – From dataset generation to accessing and visualizing and disseminating results

  • Best practices for disseminating/sharing data?

– End-users and stakeholders

slide-27
SLIDE 27

Future Work

  • Waves!
  • Oyster restoration
  • Model Coupling

– watershed models to coastal ocean models – estuarine models to regional ocean models

slide-28
SLIDE 28

Thank you for your attention Questions? Remember: We all live downstream!

slide-29
SLIDE 29

By the numbers…

  • XE nodes
  • 10 meter grid (30 day run)

– 2200x2500x8 = 44,000,000 grid cells – 14,000 node hours

  • 30 meter grid (30 day run)

– 734x834x8 = 4,897,248 grid cells – 20 nodes - 640 processors – 900 node hours

slide-30
SLIDE 30

"It's never going to be a huge amount of nitrogen. I suspect it will be below 5 percent of the nitrogen that goes into the estuary, but 5 percent is 5 percent," - Ray Grizzle, PhD

University of New Hampshire. "First comprehensive study of New Hampshire oyster farming." ScienceDaily. ScienceDaily, 4 March 2016. <www.sciencedaily.com/releases/2016/03/160304120823.htm>.

Oysters are nitrogen sinks

  • Feed on phytoplankton, digest some nitrogen, and incorporate into shells and soft tissue
  • Water Clarity - Filter about 30 gallons of water a day
  • Provide habitat
  • 90% losses in oyster reefs in the 90’s due to oyster diseases (across mid-Atlantic)
slide-31
SLIDE 31

Oyster Restoration

slide-32
SLIDE 32

Oyster Restoration

slide-33
SLIDE 33

: Model configuration

30 meter grid 10 meter grid 2 meter grid DT 1 s 1 s 0.5 s Horizontal Resolution 734 x 834 (22 km x 25 km) 2201 x 2501 (22 km x 25 km) 327 x 377 (0.65 km x 0.74 km) Vertical resolution 8 sigma layers 8 sigma layers 8 sigma layers Run Length 5 days 5 days 3 days zo 0.015 m 0.015 m 0.015 m Other: Wetting and Drying algorithm, Tides ramped up over 1 day

Forcing: Analytical Tide OSU Tidal Prediction Software (OSU-TPS) Constituent Amplitude Phase M2 1.374 123.01 N2 0.303 53.88 S2 0.209 138.92 O1 0.082 63.59 K1 0.119 335.45

Corresponding to 8/1/2015

The role of resolution

slide-34
SLIDE 34
  • 30 meter, 10 meter and 2 meter grid
  • LIDAR and bathymetry
  • Has been validated with Tidal

Dissipation characteristics and vertical structure of the currents

The role of resolution

Presented at AGU Ocean Sciences 2018 Funded by Blue Waters

OBSERVATION

slide-35
SLIDE 35

F l

  • d

Ebb

* Same location as shear stress estimate from observations

The role of resolution

slide-36
SLIDE 36

(N/m2) 2 m grid 10 m grid 30 m grid Observations Flood 0.27 0.3 0.45 0.16 Ebb 0.25 0.3 0.37 0.23

The role of resolution: Is there a model resolution that can accurately represent bed shear stress? If so, what is it?

1) 2 meter grid has best estimate of bed shear stress, however flood is

  • verestimated

2) vertical resolution should also be increased (maybe 15 sigma layers) to better resolve bottom stress on flood tides

High Tide Low Tide F F F F E E E