
SLIDE 1
September 5, 2018
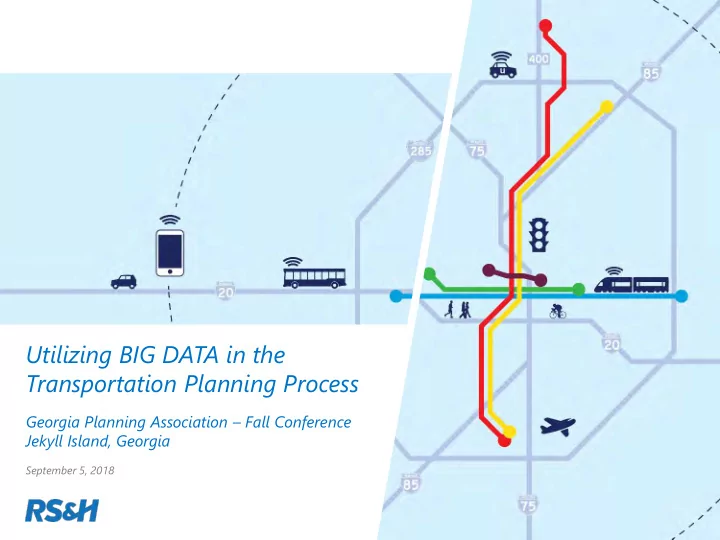
Utilizing BIG DATA in the Transportation Planning Process
Georgia Planning Association – Fall Conference Jekyll Island, Georgia
Utilizing BIG DATA in the Transportation Planning Process Georgia - - PowerPoint PPT Presentation
Utilizing BIG DATA in the Transportation Planning Process Georgia Planning Association Fall Conference Jekyll Island, Georgia September 5, 2018 Introduction Presenting Today Utilizing BIG DATA in the Transportation Planning Process 2
September 5, 2018
Georgia Planning Association – Fall Conference Jekyll Island, Georgia
Utilizing BIG DATA in the Transportation Planning Process
2
INTRODUCTION BIG DATA OVERVIEW Q&A TRANSIT PLANNING OTHER APPLICATIONS VEHICULAR PLANNING
Utilizing BIG DATA in the Transportation Planning Process
– Vehicular / Auto – Transit – Others
3
Utilizing BIG DATA in the Transportation Planning Process
4
INTRODUCTION BIG DATA OVERVIEW Q&A TRANSIT PLANNING OTHER APPLICATIONS VEHICULAR PLANNING
So….E .Exp xpert rts
Utilizing BIG DATA in the Transportation Planning Process
5
INTRODUCTION BIG DATA OVERVIEW Q&A TRANSIT PLANNING OTHER APPLICATIONS VEHICULAR PLANNING
Utilizing BIG DATA in the Transportation Planning Process
– Locations – Traveler / Trip Information
– Travel Time, Speed & Reliability
– Coordinated Incident Response – Traveler Information Services
6
Pla lanning nning Operatio ions ns
INTRODUCTION BIG DATA OVERVIEW Q&A TRANSIT PLANNING OTHER APPLICATIONS VEHICULAR PLANNING
Travel el Assi ssist stance
Utilizing BIG DATA in the Transportation Planning Process
– Operations – Congestion
– Evacuation Planning
7
INTRODUCTION BIG DATA OVERVIEW Q&A TRANSIT PLANNING OTHER APPLICATIONS VEHICULAR PLANNING
Utilizing BIG DATA in the Transportation Planning Process
8
Analysis Yesterday Today Origin and Destination License Plate Recognition
Navigation Systems
Tablet Apps Roadside, Paper and/or Online Surveys Travel Time and Speeds Floating Car Studies Radar Studies Capture Rates Up to 1% (if we were lucky) O&D
Congestion
1 Location-Based Services (LBS) 2 Global Positioning System (GPS)
INTRODUCTION BIG DATA OVERVIEW Q&A TRANSIT PLANNING OTHER APPLICATIONS VEHICULAR PLANNING
Utilizing BIG DATA in the Transportation Planning Process
9
BIG DATA SOURCES *National Performance Research Data Set (NPMRDS)
ATRI
StreetLight
AirSage TomTom INRIX* HERE*
INTRODUCTION BIG DATA OVERVIEW Q&A TRANSIT PLANNING OTHER APPLICATIONS VEHICULAR PLANNING
Utilizing BIG DATA in the Transportation Planning Process
10
BIG DATA SOURCES *National Performance Research Data Set (NPMRDS)
ATRI
StreetLight
AirSage TomTom INRIX* HERE*
INTRODUCTION BIG DATA OVERVIEW Q&A TRANSIT PLANNING OTHER APPLICATIONS VEHICULAR PLANNING
Utilizing BIG DATA in the Transportation Planning Process
11
INTRODUCTION BIG DATA OVERVIEW Q&A TRANSIT PLANNING OTHER APPLICATIONS VEHICULAR PLANNING
11
Utilizing BIG DATA in the Transportation Planning Process 12
INTRODUCTION BIG DATA OVERVIEW Q&A TRANSIT PLANNING OTHER APPLICATIONS VEHICULAR PLANNING
Utilizing BIG DATA in the Transportation Planning Process 13
INTRODUCTION BIG DATA OVERVIEW Q&A TRANSIT PLANNING OTHER APPLICATIONS VEHICULAR PLANNING
Utilizing BIG DATA in the Transportation Planning Process
A B C D E A 3 51 B 5 86 C 84 12 D 59 25 E 10 27
– Volumes – Travel Times – Personal vs. Commercial trips
INTRODUCTION BIG DATA OVERVIEW Q&A TRANSIT PLANNING OTHER APPLICATIONS VEHICULAR PLANNING
Utilizing BIG DATA in the Transportation Planning Process 15
– Assess trips from zone 1 to zone 12 passing through Gate A
INTRODUCTION BIG DATA OVERVIEW Q&A TRANSIT PLANNING OTHER APPLICATIONS VEHICULAR PLANNING
Utilizing BIG DATA in the Transportation Planning Process 16
1) Originate in 2) Destined for, or 3) Pass through
– Assess trips associated with Zone 3
INTRODUCTION BIG DATA OVERVIEW Q&A TRANSIT PLANNING OTHER APPLICATIONS VEHICULAR PLANNING
Utilizing BIG DATA in the Transportation Planning Process
– Similar to Laying “Traffic Tubes” – Generally Correspond to Roadway – Accuracy: 5 m (16 ft) – Bi-directional data available
17
INTRODUCTION BIG DATA OVERVIEW Q&A TRANSIT PLANNING OTHER APPLICATIONS VEHICULAR PLANNING
Utilizing BIG DATA in the Transportation Planning Process
– Zones Depend Upon Specific Analysis
Block Group, Block, etc…
– Data Accuracy 5m (16 ft)
18
INTRODUCTION BIG DATA OVERVIEW Q&A TRANSIT PLANNING OTHER APPLICATIONS VEHICULAR PLANNING
Utilizing BIG DATA in the Transportation Planning Process
– .CSV files
– Excel – Pivot Tables
– Graphically – Tabular Format
19
INTRODUCTION BIG DATA OVERVIEW Q&A TRANSIT PLANNING OTHER APPLICATIONS VEHICULAR PLANNING
Utilizing BIG DATA in the Transportation Planning Process
20
INTRODUCTION BIG DATA OVERVIEW Q&A TRANSIT PLANNING OTHER APPLICATIONS VEHICULAR PLANNING
20
Utilizing BIG DATA in the Transportation Planning Process
– Trip duration – Trip length – Trip speed – Trip circuity
– Heavy Duty (>26,000 lbs) vs. – Medium Duty (14,000 – 26,000 lbs)
– Separate for Auto / truck trips
21
INTRODUCTION BIG DATA OVERVIEW Q&A TRANSIT PLANNING OTHER APPLICATIONS VEHICULAR PLANNING
Utilizing BIG DATA in the Transportation Planning Process 22
INTRODUCTION BIG DATA OVERVIEW Q&A TRANSIT PLANNING OTHER APPLICATIONS VEHICULAR PLANNING
Utilizing BIG DATA in the Transportation Planning Process
23
INTRODUCTION BIG DATA OVERVIEW Q&A TRANSIT PLANNING OTHER APPLICATIONS VEHICULAR PLANNING
Utilizing BIG DATA in the Transportation Planning Process
24
» Data Coverage:
– January 2017 – December 2017
» Data Type:
– GPS Navigation Data
» Periods Analyzed
– Peak AM (6am-10am) – Peak PM (3pm-7pm)
» Focus Areas
– Personal Vehicle Travel – Average Weekday – AM Peak Inbound – PM Peak Outbound
» Utilized GDOT Traffic Counts to Estimate Trips
Zone I – Concourse (King and Queen Buildings); includes Westin Hotel and Remaining Office Campus
INTRODUCTION BIG DATA OVERVIEW Q&A TRANSIT PLANNING OTHER APPLICATIONS VEHICULAR PLANNING
Utilizing BIG DATA in the Transportation Planning Process
25
ID Name A Glenlake B North C Perimeter Place D East E Perimeter Mall F Central G Barfield H North Glenridge I Concourse J South Dunwoody K Lake Hearn L St Joseph’s Hospital M Northside Hospital N Children's Hospital O South Glenridge P West Glenridge
INTRODUCTION BIG DATA OVERVIEW Q&A TRANSIT PLANNING OTHER APPLICATIONS VEHICULAR PLANNING
Utilizing BIG DATA in the Transportation Planning Process
26 Gate Number Gate Description Outbound Direction G51 Peachtree Dunwoody Rd (North) NB G52 Mount Vernon Hwy (East) EB G53 Ashford Dunwoody Rd (North) NB G54 Ashford Center Pkwy EB G55 Valley View Rd EB G56 I-285 EB On-Ramp at Ashford Dunwoody Rd EB G57 I-285 WB On-Ramp at Ashford Dunwoody Rd WB G58 Ashford Dunwoody Rd (South) SB G59 Old Johnson Ferry Rd SB G60 Johnson Ferry Rd SB G61 Peachtree Dunwoody Rd (South) SB G62 GA 400 SB On-Ramp at Glenridge Connector SB G63 High Point Rd SB G64 Glenridge Dr (South) WB G65 I-285 WB On-Ramp at Glenridge Dr/Connector WB G66 Glenforest Rd WB G67 Glenridge Dr (Central) NB G68 Hammond Dr WB G69 Mount Vernon Hwy (West) WB G70 GA 400 SB On-Ramp at Abernathy Rd SB G71 GA 400 NB On-Ramp at Abernathy Rd NB G72 Abernathy Rd WB G73 Glenridge Dr (North) NB G74 GA 400 NB On-Ramp at Hammond Dr NB G75 I-285 EB On-Ramp at Peachtree Dunwoody Rd EB G76 GA 400 NB On-Ramp at Glenridge Connector NB G78 Glenridge Dr (South of Abernathy) SB
INTRODUCTION BIG DATA OVERVIEW Q&A TRANSIT PLANNING OTHER APPLICATIONS VEHICULAR PLANNING
Utilizing BIG DATA in the Transportation Planning Process 27
A B C D E F G H I J K L M N O P Gate Gate Description Inbound Direction
Glenlake North Perimeter Place East Perimeter Mall Central Barfield North Glenridge Concours e South Dunwood y Lake Hearn St Joseph's Hospital Northside Hospital Children's Hospital South Glenridge West Glenridge
G1 Peachtree Dunwoody Rd (North) SB 0% 8% 0% 1% 2% 3% 1% 1% 1% 1% 3% 2% 1% 1% 1% 0% G2 Mount Vernon Hwy (East) WB 2% 19% 1% 0% 4% 8% 8% 6% 3% 0% 0% 3% 1% 2% 2% 5% G3 Ashford Dunwoody Rd (North) SB 0% 0% 26% 10% 9% 2% 0% 0% 2% 4% 3% 1% 1% 1% 0% 0% G4 Ashford Center Pkwy WB 2% 0% 11% 4% 4% 2% 1% 0% 1% 1% 1% 1% 0% 0% 0% 0% G5 Valley View Rd WB 0% 0% 1% 1% 0% 0% 0% 0% 0% 0% 0% 0% 0% 0% 0% 0% G6 I-285 WB Off-Ramp at Ashford Dunwoody Rd WB 2% 4% 10% 23% 14% 3% 2% 1% 1% 17% 22% 1% 1% 1% 0% 0% G7 I-285 EB Off-Ramp at Ashford Dunwoody Rd EB 0% 1% 15% 30% 11% 1% 0% 0% 2% 27% 32% 1% 2% 0% 0% 0% G8 Ashford Dunwoody Rd (South) NB 2% 3% 4% 10% 7% 1% 0% 0% 3% 10% 8% 1% 0% 0% 0% 0% G9 Old Johnson Ferry Rd NB 0% 0% 0% 0% 0% 0% 0% 0% 0% 0% 0% 1% 0% 1% 1% 0% G10 Johnson Ferry Rd NB 1% 1% 0% 0% 0% 2% 3% 5% 3% 0% 0% 9% 8% 9% 7% 3% G11 Peachtree Dunwoody Rd (South) NB 1% 2% 3% 1% 3% 4% 1% 7% 10% 12% 2% 10% 6% 12% 5% 1% G12 GA 400 NB Off-Ramp at Glenridge Connector NB 0% 0% 0% 0% 0% 2% 3% 10% 10% 2% 6% 15% 11% 12% 18% 8% G13 High Point Rd NB 0% 0% 2% 1% 1% 1% 1% 1% 1% 1% 0% 1% 2% 2% 2% 8% G14 Glenridge Dr (South) EB 0% 1% 1% 1% 2% 2% 1% 2% 2% 0% 1% 5% 10% 11% 12% 15% G15 I-285 EB Off-Ramp at Glenridge Dr/Connector EB 1% 0% 0% 0% 0% 3% 6% 7% 4% 0% 1% 9% 14% 11% 7% 7% G16 Glenforest Rd EB 0% 0% 0% 0% 0% 0% 0% 0% 0% 0% 0% 0% 0% 0% 0% 0% G17 Glenridge Dr (Central) SB 0% 0% 0% 0% 0% 0% 0% 24% 0% 0% 0% 3% 9% 10% 15% 28% G18 Hammond Dr EB 1% 1% 3% 4% 6% 10% 16% 13% 19% 10% 4% 4% 3% 0% 0% 0% G19 Mount Vernon Hwy (West) EB 2% 6% 5% 1% 3% 6% 6% 1% 1% 0% 0% 1% 0% 0% 0% 0% G20 GA 400 NB Off-Ramp at Abernathy Rd EB NB 5% 20% 7% 1% 10% 10% 5% 0% 0% 1% 0% 0% 0% 0% 0% 0% G21 GA 400 SB Off-Ramp at Abernathy Rd SB 20% 17% 7% 4% 12% 23% 4% 1% 1% 2% 3% 1% 1% 0% 0% 0% G22 Abernathy Rd EB 11% 13% 2% 6% 9% 8% 24% 2% 5% 2% 2% 4% 2% 1% 1% 0% G23 Glenridge Dr (North) SB 20% 0% 0% 0% 0% 1% 1% 0% 0% 0% 0% 0% 1% 1% 1% 1% G24 GA 400 SB Off-Ramp at Hammond Dr SB 0% 0% 0% 3% 1% 3% 11% 11% 15% 6% 11% 8% 7% 3% 1% 9% G25 I-285 WB Off-Ramp at Peachtree Dunwoody Rd WB 1% 1% 0% 0% 1% 5% 3% 5% 15% 0% 0% 16% 13% 10% 5% 1% G26 GA 400 SB Off-Ramp at Glenridge Connector NB 0% 0% 0% 0% 0% 0% 0% 3% 0% 0% 0% 2% 5% 10% 21% 12% G27 GA 400 NB Off-Ramp at Abernathy Rd WB NB 17% 0% 0% 0% 0% 0% 1% 0% 0% 0% 0% 0% 0% 0% 0% 0% G28 Glenridge Dr (North of Abernathy) NB 10% 0% 0% 0% 0% 0% 0% 0% 0% 0% 0% 0% 0% 0% 0% 0% Sum 100% 100% 100% 100% 100% 100% 100% 100% 100% 100% 100% 100% 100% 100% 100% 100% Zone
INTRODUCTION BIG DATA OVERVIEW Q&A TRANSIT PLANNING OTHER APPLICATIONS VEHICULAR PLANNING
Utilizing BIG DATA in the Transportation Planning Process
28
10,000 15,000 20,000 25,000 30,000 H: North Glenridge J: South Dunwoody G: Barfield P: West Glenridge N: Children's Hospital O: South Glenridge M: Northside Hospital K: Lake Hearn L: St Joseph's Hosptial A: Glenlake C: Perimeter Place E: Perimeter Mall B: North I: Concourse D: East F: Central
Trips Zone
PM Outbound Trips from Zones
INTRODUCTION BIG DATA OVERVIEW Q&A TRANSIT PLANNING OTHER APPLICATIONS VEHICULAR PLANNING
Utilizing BIG DATA in the Transportation Planning Process
29
6,000 9,000 12,000 15,000 G66: Glenforest Rd WB G78: Glenridge Dr (South of Abernathy) SB G59: Old Johnson Ferry Rd SB G55: Valley View Rd EB G73: Glenridge Dr (North) NB G63: High Point Rd SB G76: GA 400 NB On-Ramp at Glenridge… G54: Ashford Center Pkwy EB G51: Peachtree Dunwoody Rd (North) NB G67: Glenridge Dr (Central) NB G60: Johnson Ferry Rd SB G68: Hammond Dr WB G65: I-285 WB On-Ramp at Glenridge… G75: I-285 EB On-Ramp at Peachtree… G58: Ashford Dunwoody Rd (South) SB G52: Mount Vernon Hwy (East) EB G64: Glenridge Dr (South) WB G69: Mount Vernon Hwy (West) WB G61: Peachtree Dunwoody Rd (South) SB G53: Ashford Dunwoody Rd (North) NB G74: GA 400 NB On-Ramp at Hammond Dr G56: I-285 EB On-Ramp at Ashford Dunwoody Rd G57: I-285 WB On-Ramp at Ashford Dunwoody… G70: GA 400 SB On-Ramp at Abernathy Rd G72: Abernathy Rd WB G62: GA 400 SB On-Ramp at Glenridge Connector G71: GA 400 NB On-Ramp at Abernathy Rd
Trips Gate
PM Outbound Trips through Gates
INTRODUCTION BIG DATA OVERVIEW Q&A TRANSIT PLANNING OTHER APPLICATIONS VEHICULAR PLANNING
Utilizing BIG DATA in the Transportation Planning Process
30
INTRODUCTION BIG DATA OVERVIEW Q&A TRANSIT PLANNING OTHER APPLICATIONS VEHICULAR PLANNING
Utilizing BIG DATA in the Transportation Planning Process
31
INTRODUCTION BIG DATA OVERVIEW Q&A TRANSIT PLANNING OTHER APPLICATIONS VEHICULAR PLANNING
– 23%: GA 400 SB at Abernathy Road – 3%: GA 400 SB at Hammond Drive
Utilizing BIG DATA in the Transportation Planning Process 32
Downtown Gainesville
INTRODUCTION BIG DATA OVERVIEW Q&A TRANSIT PLANNING OTHER APPLICATIONS VEHICULAR PLANNING
Utilizing BIG DATA in the Transportation Planning Process 33
INTRODUCTION BIG DATA OVERVIEW Q&A TRANSIT PLANNING OTHER APPLICATIONS VEHICULAR PLANNING
Utilizing BIG DATA in the Transportation Planning Process 34
INTRODUCTION BIG DATA OVERVIEW Q&A TRANSIT PLANNING OTHER APPLICATIONS VEHICULAR PLANNING
Utilizing BIG DATA in the Transportation Planning Process 35
INTRODUCTION BIG DATA OVERVIEW Q&A TRANSIT PLANNING OTHER APPLICATIONS VEHICULAR PLANNING
Utilizing BIG DATA in the Transportation Planning Process 36
INTRODUCTION BIG DATA OVERVIEW Q&A TRANSIT PLANNING OTHER APPLICATIONS VEHICULAR PLANNING
Utilizing BIG DATA in the Transportation Planning Process 37
INTRODUCTION BIG DATA OVERVIEW Q&A TRANSIT PLANNING OTHER APPLICATIONS VEHICULAR PLANNING
Utilizing BIG DATA in the Transportation Planning Process
38
INTRODUCTION BIG DATA OVERVIEW Q&A TRANSIT PLANNING OTHER APPLICATIONS VEHICULAR PLANNING
38 38
INTRODUCTION BIG DATA OVERVIEW Q&A TRANSIT PLANNING OTHER APPLICATIONS VEHICULAR PLANNING
38
Utilizing BIG DATA in the Transportation Planning Process
– Origin/Destination
– Trip purpose
combinations etc)
based, Commercial-based)
– Global view of network performance
39
INTRODUCTION BIG DATA OVERVIEW Q&A TRANSIT PLANNING OTHER APPLICATIONS VEHICULAR PLANNING
Utilizing BIG DATA in the Transportation Planning Process
– Demographics of Travelers
– Local Distribution of Home and Work Places – Regional / National Distribution of Tourists
MSA)
40
INTRODUCTION BIG DATA OVERVIEW Q&A TRANSIT PLANNING OTHER APPLICATIONS VEHICULAR PLANNING
Utilizing BIG DATA in the Transportation Planning Process
– Oldest Transit System in Georgia – 2nd Largest Transit Authority in the State
– Serving City of Savannah & Parts of Unincorporated Chatham Co. – Fixed Route, Demand-response, CAT Freedom, & Bike Share – Free Downtown Shuttle & Ferry Service
41
69 Buses 26 ADA Vehicles 4 Ferry Vessels 1,300 Bus Stops 4.25M Passengers Per Year
INTRODUCTION BIG DATA OVERVIEW Q&A TRANSIT PLANNING OTHER APPLICATIONS VEHICULAR PLANNING
Utilizing BIG DATA in the Transportation Planning Process
42 50,000 100,000 150,000 200,000 250,000 300,000 350,000 400,000
3 Year: Fixed Route Ridership
INTRODUCTION BIG DATA OVERVIEW Q&A TRANSIT PLANNING OTHER APPLICATIONS VEHICULAR PLANNING
Utilizing BIG DATA in the Transportation Planning Process
43
‒ Failing equipment ‒ Decreased reliability ‒ Changing demographics ‒ Lower fuel costs ‒ TNCs
‒ Collect and analyze data (Origin-Destination Study) ‒ Solicit community input ‒ Identify new service areas, markets, and modal
INTRODUCTION BIG DATA OVERVIEW Q&A TRANSIT PLANNING OTHER APPLICATIONS VEHICULAR PLANNING
Utilizing BIG DATA in the Transportation Planning Process
44
‒ HB 848: House Commission on Transit Governance & Funding ‒ HB 930: Unified transit governance and funding structure in Metro Atlanta region; creates the ATL as the new designated recipient of federal funds. ‒ Anticipated legislation for the remainder of the State
INTRODUCTION BIG DATA OVERVIEW Q&A TRANSIT PLANNING OTHER APPLICATIONS VEHICULAR PLANNING
Utilizing BIG DATA in the Transportation Planning Process
45
‒ Census anticipates growing / expanding UZAs ‒ Serving historically suburban and rural areas presents challenges
Source: Dr. Laurie Garrow, Dr. Thomas Douthat, Anna Nord, Sara Douglass, and Georgia Tech
INTRODUCTION BIG DATA OVERVIEW Q&A TRANSIT PLANNING OTHER APPLICATIONS VEHICULAR PLANNING
Utilizing BIG DATA in the Transportation Planning Process
Travel Patterns
AirSage travel patterns Census household / employment data CAT ridership data – stop & route level CORE Data Source 1 CORE Data Source 2
CORE Congestion Management Process CAT Origin Destination Analysis
NPMRDS
INTRODUCTION BIG DATA OVERVIEW Q&A TRANSIT PLANNING OTHER APPLICATIONS VEHICULAR PLANNING
Utilizing BIG DATA in the Transportation Planning Process
INTRODUCTION BIG DATA OVERVIEW Q&A TRANSIT PLANNING OTHER APPLICATIONS VEHICULAR PLANNING
Utilizing BIG DATA in the Transportation Planning Process
Category (April 2016) Aggregate Percentage Category (October 2015) Aggregate Percentage 24-Hour Counts* 1,445,268 N/A 24-Hour Counts* 1,452,606 N/A Day Period Counts** 1,159,165 100% Day Period Counts** 1,562,488 100% AM Peak - All Trips/Resident Classes 271,771 23.45% AM Peak - All Trips/Resident Classes 367,454 23.52% Mid-Day Peak - All Trips/Resident Classes 560,973 48.39% Mid-Day Peak - All Trips/Resident Classes 744,792 47.67% PM Peak - All Trips/Resident Classes 326,420 28.16% PM Peak - All Trips/Resident Classes 450,241 28.82% Home Worker - All Trips 149,169 12.87% Home Worker - All Trips 161,587 10.34% Home Worker - AM Peak/All Trips 31,573 2.72% Home Worker - AM Peak/All Trips 32,651 2.09% Home Worker - Mid-Day Peak/All Trips 78,387 6.76% Home Worker - Mid-Day Peak/All Trips 84,542 5.41% Home Worker - PM Peak/All Trips 39,209 3.38% Home Worker - PM Peak/All Trips 44,394 2.84% Home Worker - AM Peak/HBO 29,637 2.56% Home Worker - AM Peak/HBO 30,425 1.95% Home Worker - Mid-Day Peak/HBO 66,671 5.75% Home Worker - Mid-Day Peak/HBO 71,471 4.57% Home Worker - PM Peak/HBO 33,381 2.88% Home Worker - PM Peak/HBO 37,498 2.40% Home Worker - AM Peak/NHB 1,936 0.17% Home Worker - AM Peak/NHB 2,226 0.14% Home Worker - Mid-Day Peak/NHB 11,716 1.01% Home Worker - Mid-Day Peak/NHB 13,072 0.84% Home Worker - PM Peak/NHB 5,828 0.50% Home Worker - PM Peak/NHB 6,895 0.44% Resident Worker - All Trips 388,418 33.51% Resident Worker - All Trips 385,055 24.64% Resident Worker - AM Peak/All Trips 92,669 7.99% Resident Worker - AM Peak/All Trips 91,100 5.83% Resident Worker - Mid-Day Peak/All Trips 177,336 15.30% Resident Worker - Mid-Day Peak/All Trips 173,407 11.10% Resident Worker - PM Peak/All Trips 118,413 10.22% Resident Worker - PM Peak/All Trips 120,548 7.72% Resident Worker - AM Peak/HBW 31,077 2.68% Resident Worker - AM Peak/HBW 33,827 2.16% Resident Worker - Mid-Day Peak/HBW 30,203 2.61% Resident Worker - Mid-Day Peak/HBW 34,994 2.24% Resident Worker - PM Peak/HBW 23,769 2.05% Resident Worker - PM Peak/HBW 25,523 1.63% Resident Worker - AM Peak/HBO 26,220 2.26% Resident Worker - AM Peak/HBO 25,125 1.61% Resident Worker - Mid-Day Peak/HBO 42,950 3.71% Resident Worker - Mid-Day Peak/HBO 42,561 2.72% Resident Worker - PM Peak/HBO 35,222 3.04% Resident Worker - PM Peak/HBO 36,887 2.36% Resident Worker - AM Peak/NHB 35,372 3.05% Resident Worker - AM Peak/NHB 32,148 2.06% Resident Worker - Mid-Day Peak/NHB 104,183 8.99% Resident Worker - Mid-Day Peak/NHB 95,851 6.13% Resident Worker - PM Peak/NHB 59,422 5.13% Resident Worker - PM Peak/NHB 58,138 3.72% Outbound Commuter - All Trips 27,832 2.40% Outbound Commuter - All Trips 34,851 2.23% Outbound Commuter - AM Peak/All Trips 7,581 0.65% Outbound Commuter - AM Peak/All Trips 8,864 0.57% Outbound Commuter - Mid-Day Peak/All Trips 11,414 0.98% Outbound Commuter - Mid-Day Peak/All Trips 15,136 0.97% Outbound Commuter - PM Peak/All Trips 8,836 0.76% Outbound Commuter - PM Peak/All Trips 10,851 0.69% Outbound Commuter - AM Peak/HBW 2,438 0.21% Outbound Commuter - AM Peak/HBW 2,630 0.17% Outbound Commuter - Mid-Day Peak/HBW 2,657 0.23% Outbound Commuter - Mid-Day Peak/HBW 2,898 0.19% Outbound Commuter - PM Peak/HBW 1,857 0.16% Outbound Commuter - PM Peak/HBW 1,936 0.12% Outbound Commuter - AM Peak/HBO 2,129 0.18% Outbound Commuter - AM Peak/HBO 2,340 0.15% Outbound Commuter - Mid-Day Peak/HBO 2,284 0.20% Outbound Commuter - Mid-Day Peak/HBO 3,162 0.20% Outbound Commuter - PM Peak/HBO 2,408 0.21% Outbound Commuter - PM Peak/HBO 2,963 0.19% Outbound Commuter - AM Peak/NHB 3,014 0.26% Outbound Commuter - AM Peak/NHB 3,895 0.25% Outbound Commuter - Mid-Day Peak/NHB 6,473 0.56% Outbound Commuter - Mid-Day Peak/NHB 9,076 0.58% Outbound Commuter - PM Peak/NHB 4,572 0.39% Outbound Commuter - PM Peak/NHB 5,951 0.38%
INTRODUCTION BIG DATA OVERVIEW Q&A TRANSIT PLANNING OTHER APPLICATIONS VEHICULAR PLANNING
Utilizing BIG DATA in the Transportation Planning Process
Travel Time and Type of Traveler:
Origins and Desire Lines
Dataset: April 2016
INTRODUCTION BIG DATA OVERVIEW Q&A TRANSIT PLANNING OTHER APPLICATIONS VEHICULAR PLANNING
Utilizing BIG DATA in the Transportation Planning Process
Travel Time and Type of Traveler
AM)
Destinations and Desire Lines
Dataset: April 2016
INTRODUCTION BIG DATA OVERVIEW Q&A TRANSIT PLANNING OTHER APPLICATIONS VEHICULAR PLANNING
Utilizing BIG DATA in the Transportation Planning Process
‒ Ridership ‒ Key Areas Served ‒ High Demographic Propensity ‒ Connecting Route Structure ‒ Origins / Destinations
INTRODUCTION BIG DATA OVERVIEW Q&A TRANSIT PLANNING OTHER APPLICATIONS VEHICULAR PLANNING
Utilizing BIG DATA in the Transportation Planning Process
Travel Time and Type of Traveler
Destinations and Desire Lines
Dataset: April 2016
INTRODUCTION BIG DATA OVERVIEW Q&A TRANSIT PLANNING OTHER APPLICATIONS VEHICULAR PLANNING
Utilizing BIG DATA in the Transportation Planning Process
Screen Population and Transportation Network for Potential Express Service Criteria. Analyze Roadway Conditions for Surrounding Transportation Network Utilize Parcel Data to Identify Suitable Park- and-Ride Locations Within Catchment Area
Analyze Characteristics of Population / Employment Associated with Most Active Origins and Destinations Identify Regional Travel Behaviors (Origins / Destinations)
NPMRDS
INTRODUCTION BIG DATA OVERVIEW Q&A TRANSIT PLANNING OTHER APPLICATIONS VEHICULAR PLANNING
Utilizing BIG DATA in the Transportation Planning Process
‒ Location ‒ Densities ‒ Roadway Features
INTRODUCTION BIG DATA OVERVIEW Q&A TRANSIT PLANNING OTHER APPLICATIONS VEHICULAR PLANNING
Utilizing BIG DATA in the Transportation Planning Process
‒ Data quality control ‒ Readiness ‒ Storage ‒ Training ‒ Local data sets ‒ Staff, timing, resources
‒ Regional Analysis for adjoining counties ‒ Funding and Implementation?
INTRODUCTION BIG DATA OVERVIEW Q&A TRANSIT PLANNING OTHER APPLICATIONS VEHICULAR PLANNING
Utilizing BIG DATA in the Transportation Planning Process
56
INTRODUCTION BIG DATA OVERVIEW Q&A TRANSIT PLANNING OTHER APPLICATIONS VEHICULAR PLANNING
56 56
INTRODUCTION BIG DATA OVERVIEW Q&A TRANSIT PLANNING OTHER APPLICATIONS VEHICULAR PLANNING
56
Utilizing BIG DATA in the Transportation Planning Process
57
INTRODUCTION BIG DATA OVERVIEW Q&A TRANSIT PLANNING OTHER APPLICATIONS VEHICULAR PLANNING
– HERE – INRIX – TomTom
– Regional Integrated Transportation Information System (RITIS) – FHWA’s National Performance Research Data Set (NPMRDS)
Utilizing BIG DATA in the Transportation Planning Process
58
INTRODUCTION BIG DATA OVERVIEW Q&A TRANSIT PLANNING OTHER APPLICATIONS VEHICULAR PLANNING
Utilizing BIG DATA in the Transportation Planning Process 59
INTRODUCTION BIG DATA OVERVIEW Q&A TRANSIT PLANNING OTHER APPLICATIONS VEHICULAR PLANNING
BIG DATA
Utilizing BIG DATA in the Transportation Planning Process
steve.cote@rsandh.com 678-528-7220 rachel.hatcher@rsandh.com 678-528-7231 kai.zuehlke@rsandh.com 678-528-7217
Utilizing BIG DATA in the Transportation Planning Process