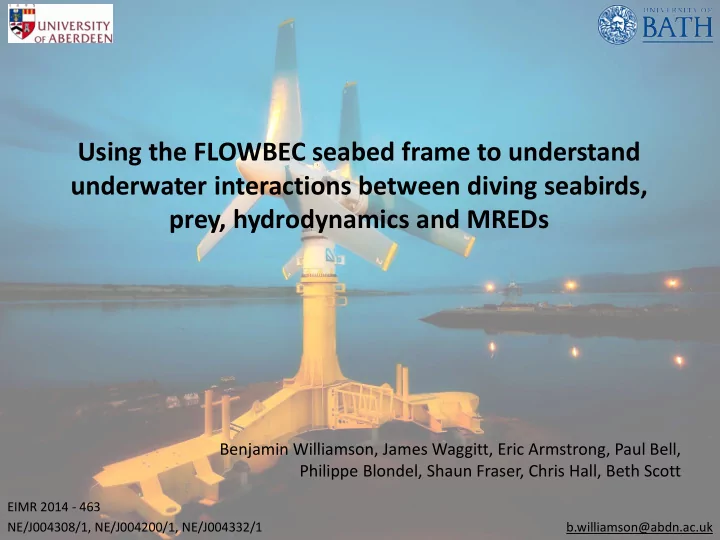

Using the FLOWBEC seabed frame to understand underwater interactions between diving seabirds, prey, hydrodynamics and MREDs Benjamin Williamson, James Waggitt, Eric Armstrong, Paul Bell, Philippe Blondel, Shaun Fraser, Chris Hall, Beth Scott EIMR 2014 - 463 NE/J004308/1, NE/J004200/1, NE/J004332/1 b.williamson@abdn.ac.uk
FLOWBEC upward facing sonar platform • Entire water column (plankton, fish, seabirds, marine mammals) • Captures movement, behaviour and interactions with MREDs • Self-contained, portable between sites • Continuously samples spring/neap 2-week period • Complemented by concurrent: • hydrodynamic model data • above water radar and bird observations • Field proven : 5 × 2-week deployments at EMEC, Orkney, UK
FLOWBEC upward facing sonar platform Simrad EK60 echosounder (38, 120, 200 kHz) ADV bird and fish abundance, school behaviour current, temperature, depth • • multi-frequency target identification • morphology of turbulence, plankton Fluorometer • chlorophyll (phytoplankton) • Imagenex multibeam sonar (260 kHz) interactions of fish, diving seabirds, marine • mammals with MREDs Axis of tidal flow Surface target tracking, avoidance behaviour • 120° Swath Seabed 20-50m Multibeam EK60
FLOWBEC upward facing sonar platform Multibeam for target tracking Multibeam for target tracking Multibeam for target tracking EK60 for multifrequency ID EK60 for multifrequency ID History (seconds) History (seconds) History (seconds) t=-7s t=-7s t=-7s t=0 (now) t=0 (now) t=0 (now) Sea surface Sea surface Target tracked with Target tracked with Target tracked with Fish shoal Fish shoal multibeam multibeam multibeam Guillemots / Guillemots / razorbills razorbills Turbine structure Turbine structure Turbine structure and seabed and seabed and seabed Targets moving Targets moving with tide with tide 10-50m 10-50m 10-50m EK60 EK60 EK60 Time (9 minutes shown at Wave Energy Site) Time (9 minutes shown at Wave Energy Site) (20m shown) (20m shown) (20m shown) Acoustic classification ground truthed by shore observations
FLOWBEC first analyses Multibeam tracking of diving guillemots/razorbills feeding beneath a fish shoal at a wave energy site
FLOWBEC target tracking Green = Turbine structure, Dashed = Expected blade radius Fish shoal Fish shoal Fish shoal 38 kHz 120 kHz 200 kHz Relative Backscatter = School of Mackerel Korneliussen (2010) Target detection using the multibeam and EK60 • Target tracking using the multibeam • Multifrequency analysis using the EK60 • 38 120 200 Frequency (kHz)
Target vertical distribution next to Atlantis turbine structure 32 All tracked targets (mammals, Tracked Target height (m) Total = 3909 birds, fish schools, individual fish) next to Atlantis turbine structure Green = Turbine structure = 3909 tracks over 2 week period Dashed = Expected blade radius 0 0 Frequency of targets 800 21 Total = 227 Tracked Target height (m) Vertical overlap with turbine height = 227 tracks over 2 week period 0 0 Frequency of targets 15
Target Classification Large Single School Target Small Diving School Bird
Vertical distribution (collision risk) of target classes Target Vertical Distribution 40 Target height (m) Green = Turbine structure Dashed = Expected blade radius Large School 0 0 100 200 Target Intensity 500 600 700 Target Vertical Distribution 40 Target height (m) Green = Turbine structure Small Diving Dashed = Expected blade radius School Bird 0 0 100 200 Target Intensity 500 600 700
FLOWBEC upward facing sonar platform Benefits: Limitations: High range (≈50m) and good detection Limited detail for species identification • • Visibility / illumination independent Observation of final (<1m) interaction • • – collision Y/N? Small data volumes (raw ≈ 6GB/day) • – effect of collision? Low power (self-contained) • Any behavioural response to acoustics? • Realtime processing feasible • Potential solution: multi-instrument integration…
Multi-instrument integration Intelligent triggering of instruments across multiple scales Combines large-scale with fine-detail • Reduces data processing / archival • Passive acoustic: localisation (~1km) or tag receiver Cycle passive / active acoustics • MBES: behaviour / interactions Trigger camera for ID / detail • EK60: abundance / ID Camera: ID / fine-scale behaviour Archival tags integrated in post-processing
FLOWBEC Summary Investigating the ecological effects of installing and operating MREDs – Determine collision risk probabilities – Define vertical habitat use and any changes in habitat use pre & post installation for a range of species – Increase overall environmental understanding of mobile animal use of high energy sites – Inform marine spatial planning, device design, licensing and operation – Guide scaling-up to arrays and new site selection – Increase predictive power to eventually reduce monitoring
Using the FLOWBEC seabed frame to understand underwater interactions between diving seabirds, prey, hydrodynamics and MREDs EIMR 2014 - 463 NE/J004308/1, NE/J004200/1, NE/J004332/1 b.williamson@abdn.ac.uk
Recommend
More recommend