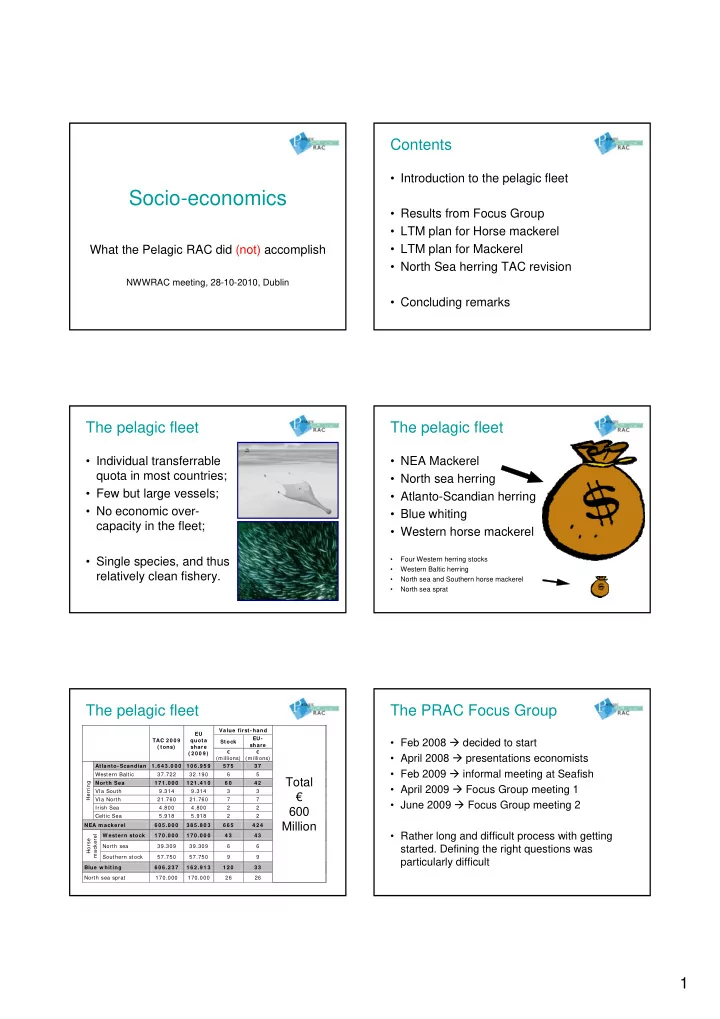
socio economics
play

Socio-economics Results from Focus Group LTM plan for Horse - PDF document

Contents Introduction to the pelagic fleet Socio-economics Results from Focus Group LTM plan for Horse mackerel LTM plan for Mackerel What the Pelagic RAC did (not) accomplish North Sea herring TAC revision NWWRAC


  1. Contents • Introduction to the pelagic fleet Socio-economics • Results from Focus Group • LTM plan for Horse mackerel • LTM plan for Mackerel What the Pelagic RAC did (not) accomplish • North Sea herring TAC revision NWWRAC meeting, 28-10-2010, Dublin • Concluding remarks The pelagic fleet The pelagic fleet • Individual transferrable • NEA Mackerel quota in most countries; • North sea herring • Few but large vessels; • Atlanto-Scandian herring • No economic over- • Blue whiting capacity in the fleet; • Western horse mackerel • Single species, and thus • Four Western herring stocks • Western Baltic herring relatively clean fishery. • North sea and Southern horse mackerel • North sea sprat The pelagic fleet The PRAC Focus Group Value first- hand EU ( Jointly) EU- • Feb 2008  decided to start TAC 2 0 0 9 quota Stock S / A exploited share ( tons) share by € € ( 2 0 0 9 ) • April 2008  presentations economists (millions) (millions) Atlanto- Scandian 1 .6 4 3 .0 0 0 1 0 6 .9 5 9 5 7 5 3 7 S 1 ,2 ,3 ,4 ,5 • Feb 2009  informal meeting at Seafish Western Baltic 37.722 32.190 6 5 S 1,2 Total Herring North Sea 1 7 1 .0 0 0 1 2 1 .4 1 0 6 0 4 2 S 1 ,2 • April 2009  Focus Group meeting 1 VIa South 9.314 9.314 3 3 A 1 € VIa North 21.760 21.760 7 7 A 1 • June 2009  Focus Group meeting 2 Irish Sea 4.800 4.800 2 2 A 1 600 Celtic Sea 5.918 5.918 2 2 A 1 Million NEA m ackerel 6 0 5 .0 0 0 3 8 5 .8 0 3 6 6 5 4 2 4 S 1 ,2 ,3 mackerel • Rather long and difficult process with getting W estern stock 1 7 0 .0 0 0 1 7 0 .0 0 0 4 3 4 3 A/ S* 1 ,2 Horse North sea 39.309 39.309 6 6 A 1 started. Defining the right questions was Southern stock 57.750 57.750 9 9 A 1 particularly difficult Blue w hiting 6 0 6 .2 3 7 1 6 2 .9 1 3 1 2 0 3 3 S 1 ,2 ,3 ,4 North sea sprat 170.000 170.000 26 26 A 1 1

  2. The PRAC Focus Group The PRAC Focus Group Main questions to focus on: Additional (sub) questions: • What socio-economic issues can be • What data is needed and where is it addressed by Pelagic RAC in isolation? available (DCR)? • What parameters should be measured? • How can Pelagic RAC integrate socio- • What practical input can the Pelagic RAC economic aspects into its advice based have on data supply? on biological science? The PRAC Focus Group The PRAC Focus Group • At the same time, PRAC was consulted by the EC to provide input • Conclusions from the Focus Group: on design of Impact Assessment for Celtic Sea herring LTM plan. Therefore, PRAC chose this as a case study. – catches and the value of those catches; – The Economics Unit of the EC should be (more) – fishing effort, in terms of vessel numbers, activity and kWh deployed, involved when preparing for IA for LTM plans. – and the costs (both fixed and variable) of deploying such effort; – We have to recognize that economic data is not – employment associated with this activity – net revenue from the resource readily available, we could urge the members, but – if possible, additional incidental impacts on populations of other otherwise there is not much else we can do. marine organisms. – We could produce socio-economic picture of the • PRAC unfortunately did not get clear what they meant, if they pelagic fleet for ourselves. Even if only descriptive, were from a standard format or who had identified them. Some were not suitable for pelagic fisheries in our opinion. this might provide some clarity to the RAC members during discussions. LTM plan for horse mackerel LTM plan for horse mackerel • Motivation for industry to initiate plan: • HCR: 2000 Egg survey index 1500 1000 – Feeling that stock was being underexploited • 50% constant 500 (75.000 tons) – SALY’s from ICES and roll-over of TACs 0 1980 1985 1990 1995 2000 2005 2010 because there was no scientific basis for an • 50% changed alternative based on slope of last three egg surveys 2

  3. LTM plan for horse mackerel LTM plan for mackerel • LTM plan in place since 1999 • LTM plan re-evaluated in 2008 • John Simmonds (FRS Marine Lab) was running MSEs and attended a number of PRAC meetings • At the end of the process, a recommendation was made to the Commission LTM plan for mackerel LTM plan for mackerel Rule Parameters Outcomes Other Information Method Perc Targ Trig Cmean IAV 7+ F SSB Nchange Nup Ndown Cup Cdown Risk 1200 1000 TargC 12.5 550 2500 559 3.5 0.45 0.172 3385 4.3 2.6 1.7 38.4 -47.1 4.9 Always TargC 15 550 2400 562 3.5 0.45 0.173 3369 3.9 2.3 1.6 43.1 -52.5 4.5 800 TargC 10 560 2600 564 3.7 0.45 0.178 3318 5.3 3.2 2.1 34.4 -41.1 4.5 TargC 10 570 2600 569 3.8 0.44 0.184 3285 5.5 3.3 2.2 33.9 -41.1 4.5 600 TargC 12.5 570 2600 572 4.3 0.44 0.181 3286 5.2 3.1 2.1 40.7 -49.1 4.7 TargC 15 570 2600 574 4.7 0.45 0.177 3336 4.9 2.9 2 46.6 -57 4.1 400 TargC 12.5 590 2700 583 5 0.44 0.189 3239 6 3.5 2.5 42.6 -50.9 4.8 TargC 10 620 3100 588 6 0.43 0.192 3205 8.1 4.7 3.4 39.4 -45.3 4.8 200 TargC 12.5 610 2900 593 6.1 0.43 0.192 3206 7 4.1 3 45.1 -53.8 4.4 0 TargC 10 670 3500 599 7.3 0.43 0.197 3166 9.6 5.5 4.1 42.4 -47.9 5 TargC 12.5 640 3100 601 7.4 0.42 0.206 3133 8.2 4.7 3.5 48.2 -56.2 4.4 1 2 3 4 5 6 7 8 9 10 11 12 13 14 15 16 17 18 19 20 21 TargC 10 690 3500 610 7.5 0.42 0.201 3122 9.8 5.6 4.1 43.7 -49.3 4.6 TargC 12.5 700 3500 614 9 0.42 0.205 3087 9.7 5.5 4.2 52.3 -60.1 4.8 1200 TargC 15 700 3400 623 9.9 0.41 0.213 3029 9.5 5.4 4.1 59.4 -70.3 4.1 Only above B trig 1000 TargHR 10 0.2 2800 623 9.1 0.42 0.206 3089 11 6.4 4.6 50.4 -56.1 4.4 800 TargHR 12.5 0.2 2900 624 11.2 0.42 0.207 3081 11 6.2 4.8 61.2 -69.2 4.8 TargHR 15 0.2 2400 634 12.7 0.41 0.22 2970 11 6 5 71.2 -79.3 5 600 TargHR 17.5 0.2 2500 635 14.5 0.41 0.213 3017 11 6.1 4.9 80.1 -92 3.9 400 TargHR 17.5 0.21 2900 641 15 0.4 0.219 2988 11 6.1 4.9 82.8 -97.6 4.7 TargHR 20 0.21 2800 642 16.5 0.4 0.221 2966 11 6.1 4.9 91.1 -107.3 4.5 200 TargHR 25 0.21 2100 646 18.7 0.38 0.234 2829 11 6 5 104.1 -122.5 4.9 TargHR 25 0.21 2700 647 19.5 0.4 0.221 2971 11 6.1 4.9 107 -128.2 4.2 0 1 2 3 4 5 6 7 8 9 10 11 12 13 14 15 16 17 18 19 20 21 NS herring TAC revision NS herring TAC revision • 2010 TAC 4% • LTM plan in place since 1995 lower then 2009 • Low recruitment since 2002 • 15% IAV rule • TAC reduced from 535 - 164 kt in 5 years prevents TAC • LTM plan revised in 2008 to adjust to low increase back to recruitment regime HCR • Asked STECF to • Perception of SSB was changed this year: recalculate 2010 – ICES missed 2006 year class TAC based on new – Fish grew faster in 2009 then expected information – Assumed overshoot of TAC did not happen 3

  4. NS herring TAC revision NS herring TAC revision • EC replied not to • PRAC recommends want to ask STECF that EC revises the TAC for 2010 • For some reason accordingly STECF makes calculations • EC replies not to anyway (July), and want to, with concludes that TAC awkward biological 2010 could be 20% arguments higher NS herring TAC revision Concluding remarks This is a purely socio- economic discussion. 0,4 • Pelagic RAC has made considerable attempts to There simply are no include socio-economics in its recommendations biological arguments to 0,3 unfortunately with only limited results claim that the correction could not be made. • Probably, dealing with socio-economics as an 2002 The resistance that the Fbar isolated issue is more difficult than trying to 0,2 PRAC met from the EC on this, first surprised recognise ad-hoc opportunities where it may be 2010 2011 us, then slowly started to dealt with integrally (this might mean focussing worry us, but over the 2011 0,1 2009 course of this year has on details, rather then on the big picture). become a huge frustration to the industry • Surprisingly, with some of the more successful members of the PRAC. 0 0,0 0,5 1,0 1,5 2,0 cases (mackerel) support came from an They just not feel that SSB (MLN tons) unexpected corner: biological scientists. they are being taken HCR Realised F seriously Projection based on LTM plan Projection based on PRAC proposal Concluding remarks • EC seems reluctant to accept socio- economically driven advice • Even when based on analysis by STECF and without compromising biological sustainability objectives • As long as EC and Council do not clearly show that they are receptive to socio-economic arguments, what is the point for the RACs to be going at great lengths to find them? 4

Download Presentation
Download Policy: The content available on the website is offered to you 'AS IS' for your personal information and use only. It cannot be commercialized, licensed, or distributed on other websites without prior consent from the author. To download a presentation, simply click this link. If you encounter any difficulties during the download process, it's possible that the publisher has removed the file from their server.

Recommend


More recommend