
SLIDE 1
4/5/2012 1
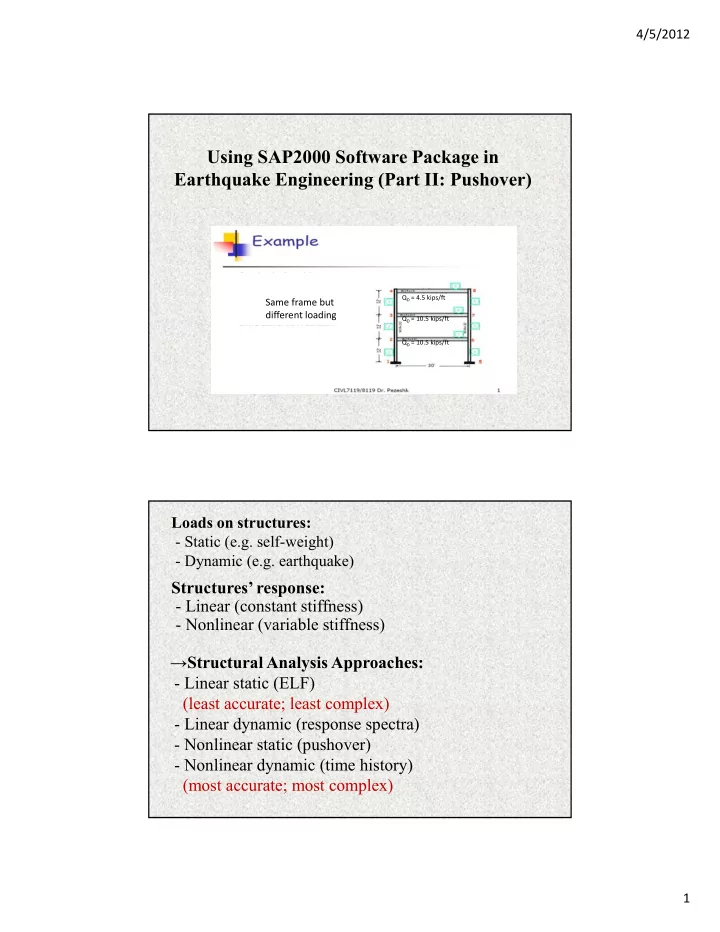
Using SAP2000 Software Package in Earthquake Engineering (Part II: Pushover)
Same frame but different loading
QD = 4.5 kips/ft QD = 10.5 kips/ft QD = 10.5 kips/ft
Loads on structures:
- Static (e.g. self-weight)
- Dynamic (e.g. earthquake)
Structures’ response: Linear (constant stiffness)
- Linear (constant stiffness)
- Nonlinear (variable stiffness)
→Structural Analysis Approaches:
- Linear static (ELF)
(least accurate; least complex) ( p )
- Linear dynamic (response spectra)
- Nonlinear static (pushover)
- Nonlinear dynamic (time history)