
SLIDE 1
Using Crowdsourced Data and Open Source Tools in Government
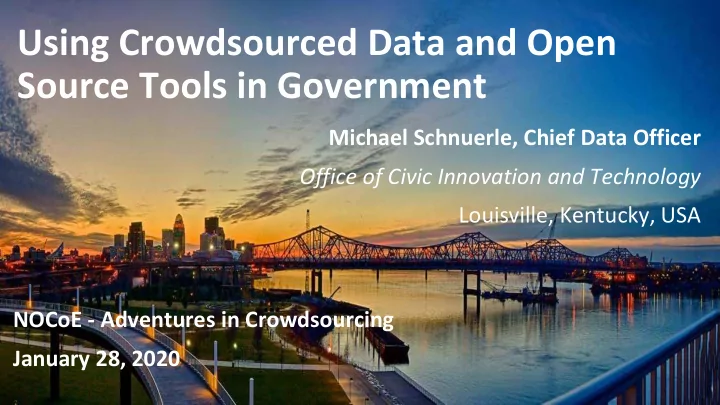
Michael Schnuerle, Chief Data Officer Office of Civic Innovation and Technology Louisville, Kentucky, USA NOCoE - Adventures in Crowdsourcing January 28, 2020
Using Crowdsourced Data and Open Source Tools in Government Michael - - PowerPoint PPT Presentation
Using Crowdsourced Data and Open Source Tools in Government Michael Schnuerle, Chief Data Officer Office of Civic Innovation and Technology Louisville, Kentucky, USA NOCoE - Adventures in Crowdsourcing January 28, 2020 Office of Civic
Michael Schnuerle, Chief Data Officer Office of Civic Innovation and Technology Louisville, Kentucky, USA NOCoE - Adventures in Crowdsourcing January 28, 2020
Mayor Greg Fischer
Created Innovation office in 2010
Grace Simrall
Chief of Civic Innovation and Technology
Ed Blayney
Civic Technology Manager
Michael Schnuerle
Data Officer
TBD
Senior Data Analyst
Ricky Santiago
Innovation Project Manager
Chris Seidt
IT Director
Sioban King
Innovation and Improvement
Coordinator Information Technology
web: OPI.LSVLL.io/innovation
government projects. Public hackathons.
50,000 active daily users in Louisville
Data Officer| Bellarmine Presentation
Office of Performance Improvement and Innovation
OPI2
Waze sends us traffic jams, alerts, and user reports. You can see all of that combined on Waze's Live Map: www.waze.com/en-GB/livemap
Thunder Over Louisville Fireworks show to kick
Kentucky Derby festivities
Animated Map of people leaving downtown after event
Waze use is higher on faster roads vs 311 use
Static Map Animated Map
Genesis PULSE MASSDOT
Real-time notifications of crashes and road closures Ability to find crash scenes easier and faster Best navigation to incidents using Waze SDK Reducing response times
a paid study.
routing to optimize future events.
Using the CCP data is complicated. Jurisdictions have spent hundreds of thousands of dollars on the infrastructure, databases, and reporting tools based off just the Waze data.
Waze Analytics Relational-database Platform takes the Waze CCP data feed and processes it into a cloud database system for historic and real-time querying, analysis, API hooks, mapping.
Over 80 Govs on board and 15+ are using it for less than $200/m in cloud costs. Paid by sponsors
Blog Post and Downloads: medium.com/louisville-metro-opi2/
Using WARP and Power BI, we can replicate $50,000 traffic studies, for free on and on-demand. Power BI Tool Online: bit.ly/WazePowerBI
pennmusa.github.io/MUSA_801.io/
Since the Power BI tool connects to an uses the Waze WARP schema, you can use this free tool too for your area when you deploy WARP. Instructions on the project page: github.com/LouisvilleMetro/WazeCCPProcessor Deployed in Anchorage in 30 mins on a plane!
OGC is a network of government agencies working on
www.GovInTheOpen.com
We work collaboratively with residents, researchers, other cities and companies on Github. See the tools and projects we publish there, jump in and help out if you can.
Data Governance | Grow Data Capacity
data.LouisvilleKY.gov Open Source (free) DKAN
with departments in charge of their data.
Crowdsourced Mapping Data
415,000 buildings. 398,000 addresses.
Use data to drive decisions and see
improvement.
Mayor Greg Fischer at Code for America Summit
Most gov employees focused on the daily work. Mayor’s culture encourages breakthrough and innovation work. Civic Innovation department is run like a start-up: Connect the dots, partner, prove value, find future funding. Focus Areas:
1. Smart City/Smart Home 2. Tech Enabled Public Health 3. Social Innovation 4. Maker/Hacker Community
Values: Data-driven compassion/ digital inclusion
Innovation Grant Funds - Grand Total: $13,589,568 Cash Awards: $11,704,568 - includes Bloomberg Philanthropies, US Dept of Labor, Kauffman Foundation, Robert Wood Johnson Foundation, PNC Foundation, US Housing and Urban Development, Kentucky Transportation Cabinet from US DOT, Amazon Web Services, and JP Morgan Chase. In-Kind Awards: $1,885,000 Equals 27 years of our entire operating expenses.
Office of Civic Innovation - Projects, Programs, Funding
50+ people who manage data from every department.
Expand department’s existing data capacity. Together build skills and efficiency, learn new tools, share data, network, and get rewarded.
Data Gov Website
Michael Schnuerle Data Officer michael.schnuerle@louisvilleky.gov @LouDataOfficer
Website: opi.lsvll.io/innovation Open Data: Data.LouisvilleKY.gov