US Health Care is in deep trouble The US Health Care System - - PDF document

us health care is in deep trouble
SMART_READER_LITE
LIVE PREVIEW

US Health Care is in deep trouble The US Health Care System - - PDF document

VS. What Well Talk About Quality, Costs, & Special Interests: 1. Problems with US Health Care Can We Change Our Behavior in time to Save US Health Care? 2. How new information technologies can address some of the problems Thomas M.


slide-1
SLIDE 1

1

Thomas M. Vogt, MD, MPH, FAHA Kaiser Permanente Center for Health Research, Hawaii

VS.

Quality, Costs, & Special Interests:

Can We Change Our Behavior in time to Save US Health Care?

1. Problems with US Health Care 2. How new information technologies can address some of the problems 3. Changes in system and personal behaviors and expectations needed to address the problems

What We’ll Talk About

US Health Care is in deep trouble

Regulatory, legal, and cultural incentives prevent us from:

  • Setting priorities
  • Managing costs to optimize outcomes
  • Stopping what doesn’t work

excessive care for the insured

  • Insuring those who most need care

The US Health Care System

Lost in the Forest

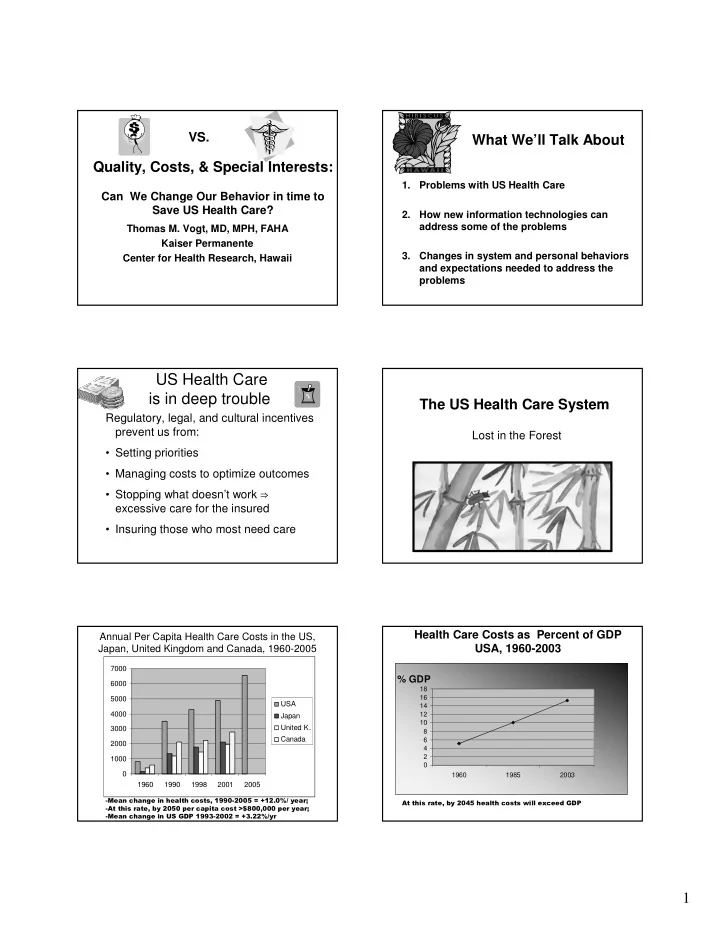
Annual Per Capita Health Care Costs in the US, Japan, United Kingdom and Canada, 1960-2005

1000 2000 3000 4000 5000 6000 7000 1960 1990 1998 2001 2005 USA Japan United K. Canada

  • % GDP

2 4 6 8 10 12 14 16 18 1960 1985 2003

Health Care Costs as Percent of GDP USA, 1960-2003

slide-2
SLIDE 2

2

Children’s Well Being: Overall and Health Ranks in 21 Developed Nations

The Economist, Feb. 17, 2007 from UNICEF 2005 data

5 10 15 20 25 Netherlands Italy France USA Overall Rank Health Rank

  • No. developed nations lacking nearly universal health care

coverage = 1 (48 million US uninsured & rising fast)

WHY ARE HEALTH COSTS SOARING? We probably put too many people in the hospital.

  • OOPS. GUESS THAT’S NOT IT

Hospital Discharges Per 100,000 Persons

5 10 15 20 25 30 1980 1985 1990 1995 2000 2005 Year Discharges Per 100,000 Australia Canada Finland France Japan Norway Spain Sweden United Kingdom USA

WHY ARE HEALTH COSTS SOARING?

Drugs cost a fortune. We must spend more

  • n drugs than other countries.

Pharmaceutical Spending (% of Total Health $)

5 10 15 20 25 1980 1985 1990 1995 2000 2005 Year

% of Spending on Drugs

Australia Canada Finland France Japan Norway Spain Sweden United Kingdom USA NOT THAT EITHER.

WHY ARE HEALTH COSTS SOARING?

Hospitals are expensive. Maybe we have too many hospital beds?

slide-3
SLIDE 3

3

Hospital Beds per 1000 Persons

1 2 3 4 5 6 7 1980 1985 1990 1995 2000 Year Beds per 1000 Australia Canada Finland France Norway Spain Sweden United Kingdom USA

  • HMM. NOT THAT EITHER.

WHY ARE HEALTH COSTS SOARING?

Maybe we have too many too many doctors?

Doctors per 1000 People

0.5 1 1.5 2 2.5 3 3.5 1980 1985 1990 1995 2000 Year Doctors per 1000 Australia Canada Finland France Japan Norway Spain Sweden United Kingdom USA WELL, WHAT THEN?

WHY ARE HEALTH COSTS SOARING?

Maybe it’s because we live so much longer than other countries?

2003 Health Care Costs & Life Expectancy in 19 Developed Nations 1000 2000 3000 4000 5000 6000 76 77 78 79 80 81 Life Expectancy Ann Expend USA Japan Greece Denmark Italy Canada Spain Norw ay Why do we look so bad when we spend so much?

  • USA 2006: $6697/person! – 36% increase in 3 yrs

[= $26788 for a family of 4]

Countries & Areas that Spend Less Than Half

  • f the US per capita on Health Care and Have

Higher Life Expectancies (in order from highest)

Andorra, Macau, Singapore, San Marino, Hong Kong, Japan, Switzerland, Sweden, Australia, Iceland, Canada, Cayman Islands, Italy, France, Monaco, Lichtenstein, Spain, Norway, Israel, Aruba, Greece, Austria, Virgin Islands, Netherlands, Malta, Luxembourg, Germany, New Zealand, Belgium, United Kingdom, Finland, Jordan, Bermuda, Saint Helena, Puerto Rico, Cyprus, Denmark

Source: http://www.geographyiq.com/ranking/ranking_life_expectancy_at_birth_ aall.htm [based on US Dept. of State data and CIA World Fact Book]

slide-4
SLIDE 4

4

WHY ARE HEALTH COSTS SOARING?

“At least 90% of the care we give is unnecessary.”

Archie Cochrane, 1978 Personal communication

“Our focus…should be on eliminating the gross inefficiencies…in the US health care system. If we do that, we will be able to cover the uninsured while spending less than we do now.”

Uwe Reinhardt, quoted in Krugman, Wells NY Rev of Books, 53; 3-23-2006

“The US health care system becomes a more embarrassing disaster each year…”

Donald Kennedy Science 2003;301:895

WHY ARE HEALTH COSTS SOARING?

“…I look at the U.S. health care system and see an administrative monstrosity, a truly bizarre mélange…”

Henry Aaron NEJM 2003, 349:801

“An epidemic of waste blights the US Health Care delivery system…[the system] is not safe…is not effective…is not efficient...is not patient-centered…is not timely…[and] is not equitable.”

Roger W. Bush, 2007 JAMA 2007, 297:871

WHY ARE HEALTH COSTS SOARING?

“President Bush is committed to assuring that the United States continues to have the finest health care system in the world.”

<whitehouse.gov> (2003) (since removed)

Well…it’s pretty serious. We’ll know a lot more after the autopsy.

Why Do We Spend So Much More Than Other Nations?

  • We don’t relate costs of care

to outcomes

  • We don’t set priorities that

maximize benefit from available resources

  • We don’t rationally translate science into

medical practice

Why Do We Spend So Much More Than Other Nations?

  • We can’t stop doing what doesn’t work
  • We do too much of what does work –

duplicative facilities drive vast excess

  • Bureaucracy of plans & insurers adds

>$65 billion in annual costs.

  • We don’t systematically learn

from our experiences

slide-5
SLIDE 5

5

Why Do We Spend So Much More Than Other Nations?

  • Malpractice laws & “community

practice” standards keep us from applying what we know

  • Monopolistic drug & device

patent laws

  • Congress won’t consider real reform
  • -they won’t get re-elected if they do

US Health Care: Summary

  • US per capita health care costs are more

than twice those of any other nation

  • US outcomes are, overall, among the

worst of all developed nations

  • Superb care is available, but not

consistently, and not for the uninsured

US Health Care: Summary

  • The US is the only developed nation

lacking nearly universal health care

  • US health costs threaten the entire

economy

  • The current system is an unsustainable

disaster

US Health Care: Summary

The greatest threat to the quality of American health is the strange notion that health care should be unrestrained by cost or by lack of evidence of benefit. We ration people instead of care. What Can We Do About the Situation?

  • Collect the right information
  • Pay attention to it
  • Do what is proven instead
  • f what is fashionable
  • Change institutional & system

behaviors & expectations Three Steps toward Fixing the System

  • I. Better information – Electronic medical

records (EMRs) offer many opportunities to improve care and efficiency

  • II. Change individual behaviors to improve

lifestyles behaviors that enhance health.

  • III. Change system behaviors to support
  • ptimal health care from available

resources

slide-6
SLIDE 6

6

I. Better Information from Electronic Records

Person-Time Coverage (PTC)

“…electronic health record (EHR) databases from millions

  • f people could rapidly advance the U.S. evidence

base for clinical care.”

Lynn Etheredge Health Affairs. 2007; 26 (2):w107-w118

How Can EMR Systems Help the Situation?

Electronic medical records allow us to examine the relation of past patterns of care to outcomes of care at low cost and in defined populations.

How Can EMR Systems Help the Situation?

Electronic medical records can:

  • Identify care variations across systems &

practitioners

  • Relate practice variations to outcomes & cost
  • Pinpoint and facilitate repair of failures and

implementation of successes.

  • Help determine how to stop doing what

doesn’t work

There is a downside

“.. a wealth of information creates a poverty

  • f attention, and a need to allocate that

attention efficiently..."

Herbert Simon, 1971

“I have my own method for choosing the best treatment. It’s quicker than reading all those journals.”

Too Much Information Isn’t Always a Good Thing

Much information is of poor quality or is inadequate to address key questions:

  • surveys with low response rates
  • biased samples and questions
  • insufficient numbers to address questions asked
  • invalid statistical analyses (or none at all), etc.

Remember GIGO – Garbage in, garbage out

slide-7
SLIDE 7

7

The PTC Approach Person-Time Coverage is a method for using EMRs to:

  • Set priorities
  • Identify and repair dysfunctional

processes

  • Transfer resources from areas of low

benefit to areas of higher benefit What is Person-Time Coverage? Preventive Services-offered at set intervals PI (Prevention Index) = The proportion of person-time that an eligible individual is appropriately covered by a service delivered at a set interval (e.g., mammography, BP, lifestyle risk assessment)

1 2

% time covered % uncovered

Recurrent Interval Service – e.g., Mammography PI Target - period of quality measure (e.g. 2005) Observation - observation period required to measure quality during target period = target period + 1 full service interval S - dates of coverage by a screening test (e.g. mammogram) P - portion of target year covered by S U - period of target not covered by S N - period of target removed due to a non-screening test PI = 100 X P/P+U

What is Person-Time Coverage? Disease Management – Treatment to Goal TLC (Time-Level of Control) = Proportion of person-time that a treatment goal is not met, weighted by the degree to which to goal is exceeded (e.g., blood pressure, HbA1c, lipid levels)

Disease Management Quality

e.g., BP Time & Level of Control Index

TLC = area under the curve of successive measurements this estimates time+amount that an individual is above treatment goal.

BP GOAL BP measures Area under curve

Examples of Person-Time Analyses: How to Define & Resolve Problems

Garbage* in Gold out GIGO Revised:

* Good, but disorganized, data

slide-8
SLIDE 8

8

% Persons Fully, Partially, or Not Covered for Lipid Screening in 2002

5 10 15 20 25 30 35 40 45 50 Percent >0-<25 25-<50 50-<75 75-<100 100

PROBLEM: Nearly all uncovered time is from the never screened. Much covered time is covered to excess (data not shown)

% of time Hypertensives were below goal in a large HMO,- 1999-2002

NOTE: Y axis is % of population

5 10 15 20 25 30 1999 2000 2001 2002 1 to 24 25 to 49 50 to 74 75 to 99 100 PROBLEM: 18-24% of hypertensive persons never had a single below-goal reading during the entire year; 45% of all person-time in 2002 was above goal (data not shown) PROBLEM: Large drop in 2001-02 due to late vaccine release—this reduces vaccine effectiveness in proportion to the fraction of the flu season that is missed.

Table 12.1 - PI Means for Influenza Vaccination, Standard Deviations, and Frequencies, >65 years of age, 1998-99 through 2001-02. Year Prevention Index Standard Deviation

1998-99 42.9 39.0 1999-2000 42.0 38.6 2000-01 25.4 28.1 2001-02 24.5 28.1

Mean PI by Practice for CRC Screening

CRC

  • No. of

Prac- tices

Mean PI of Practice 10 20 30 40 50 60 70 80 90 100 20 40 60

PROBLEM: Average PI around 40; small tails; suggests a system problem and intervention focused on system— probably availability of sigmoidoscopy & colonoscopy slots

Mean PI by Practice for Mammography

Mammography

  • No. of

Prac- tices

Mean PI of Practice 10 20 30 40 50 60 70 80 90 100 20 40 60

PROBLEM: Wide left tail suggests individual clinician variability and intervention focused on individual clinicians

  • Obese

1 2 3 4 5 6 7 8 <30 30-<35 35-<40 40-<45 45-<50 50-<55 55-<60 60-<65 65-<70 70-<75 % Patients Who Lost Weight, 2002-05 N

  • . practices

Obese

78% of obese

  • pts. lost wt.

32% of pts. lost wt.

slide-9
SLIDE 9

9

Range of PI Scores Across 336 Primary Care Providers, 2002

10 20 30 40 50 60 70 80 90 100 Tobacco Mamm Pap Lipid Lo 25% 50% 75% Hi PROBLEM: Large differences between high and low performance; high represents what is possible now in this setting

Range of PI Scores Across 336 Primary Care Providers, 2002

10 20 30 40 50 60 70 80 Flu Vac Pneu Vac CRC Sc Chlam Sc Osteo Sc Lo 25% 50% 75% Hi

BP Screening by age and gender

Blood Pressure Screening PI 1999-2002 by Age and Gender

50 60 70 80 20 30 40 50 60 70 80 Age BP PI Female Male

PROBLEM: Though younger men are at higher risk than younger women, they are less likely to be screened 10 20 30 40 50 60 70

  • Pract. 1
  • Pract. 2
  • Pract. 3
  • Pract. 4

Interact PI CVD/100 PY Hosp d/per yr Visits/per yr

Relation of Prevention Index Scores for Interactive Services to Morbidity & Utilization Rates in Four Clinical Practices

Hypothetical data

Interactive Services require a conversation between patient and clinician – e.g. counseling on smoking, weight, diet, physical activity “I have plenty of time to do prevention” “There’s just not enough time for prevention”

Comparison of HEDIS and PI Scores

HEDIS PREVENTION INDEX

1999 2000 2001 2002 1999 2000 2001 2002

Mammography 79.3 78.9 78.7 76.4 66.4 64.6 63.5 61.9 Pap Screening 80.0 83.0 83.0 85.6 52.6 50.7 50.7 51.4 Chlamydia NA NA 48.3 49.7 18.2 18.8 19.2 19.0

PROBLEM: HEDIS screening scores overestimate coverage because they include non-screening tests and assume that, if there is any coverage at all, the entire year is covered

Source: Vogt et al. Electronic Medical Records and Prevention Quality: The Prevention Index. Amer J Prev Med, 2007;33:291-296.

% of Tests for Diagnostic-Monitoring Vs. Prevention Purposes, KPNW 2002

[Diag-Mon not counted by PI; counted by HEDIS] Test % Diag-Mon % Preventive Mammography 36.8 63.2 Pap Test 22.4 77.6 Lipid Screen 47.8 52.2 Blood Pressure 53.2 46.8 Osteoporosis 33.9 66.1 Chlamydia 41.2 58.8

slide-10
SLIDE 10

10

2002 PI Scores across 15 Clinics for Mammography and Influenza Vaccine

10 20 30 40 50 60 70 80 Low 25th% Median 75th% High Mammog Influ vac This clinic was the only one with a different method for mammography referral.

Distribution of Ranks of Mean PI Scores for 9 Services across 15 Clinics

Clinic Rank 2 4 6 8 10 12 14 Low 25% Median 75% High Clinic Rank Note wide range of average PI scores across clinic sites; however, individual provider variations are much greater than inter-clinic variations This clinic needs attention This clinic is a model for

  • thers

These Problems Deserve a System Level Response

  • Screening low risk more effectively than high risk
  • Declining mammography screening rate
  • Half of hypertensive person-time is above goal

BP

  • Half of recommended person time for preventive

care is not covered

These Problems Deserve a System Level Response

  • Wide range of performance across practices
  • Interpreting diagnostic testing as screening

success

  • Half of preventive care is in excess
  • f recommendations
  • How do high performers do it?

What Else Can Person-Time Coverage Do?

  • Measure costs of unnecessary care to

aid in resource re-allocation

  • Determine whether guidelines

adherence improves health and/or reduces costs Excess/Deficit Expenditures Per Adult Member in a large HMO, 1996 dollars

+$17.44 $9.52 $26.96 Total

+0.73 0.54 1.27 Influenza vaccine

  • 1.79

1.97 0.17 Pneumococcal vaccine +1.04 0.48 1.52 Lipid screen +7.47 2.10 9.57 Pap smear screen +4.40 0.57 4.97 Mammography screen

  • 1.86

3.23 1.38 Colorectal cancer screen +$7.45 $0.63 $8.08 Blood pressure

Net Costs Deficit Costs Excess Costs Clinical Services Excess costs = costs for non-recommended services (USPSTF) Deficit costs = costs to deliver recommended services that were not given Amt saved if USPSTF recommendations followed

slide-11
SLIDE 11

11

REAL EXCERPTS FROM PAPER RECORDS “Patient gets chest pain if she lies on her left side for over a year.” “She has had no rigors or shaking chills, but her husband states she was very hot in bed last night.” “Discharge status: Alive but without permission. The patient will need disposition, and we will therefore get Dr. X to dispose of him.” “Healthy appearing decrepit 69 year-old male, mentally alert but forgetful.” “The patient left the hospital feeling much better except for her original complaints.”

Of course, with EMR, we will lose a good laugh once in a while.

Person-time measures with an EMR and a defined population base can:

  • Determine the relation of practice

patterns to costs of care

  • Allocate resources more rationally
  • Generate patient, practice, clinic,

and system specific risk and adherence profiles

  • II. Changing Personal

Behaviors

“Lifestyle interventions [are] largely outside the paradigm of what the health care industry perceives as its proper business.”

Vogt T & Stevens V The Permanente Journal, 2003;7:11-20

Personal Beliefs That Contribute to the Problem

  • If I’m insured, I’m entitled to unlimited

medical care regardless of the evidence base and cost

  • My health is largely the doctor’s

responsibility, not mine.

  • Once I have made a change (e.g., lost 5

lbs), I can go back to doing things like I used to Sustained health behavior changes require:

  • Credible & consistent sources of advice

and information (MDs are most credible; schools & worksites most consistent)

  • Personal commitment
  • Knowledge of healthy behaviors
  • Support from family, colleagues, &

environment

  • Long-term maintenance; a change in life

style

  • Realistic expectations – Health systems are

stewards of health care dollars. You get what works; more is often worse, not better (e.g., 90,000 iatrogenic deaths/yr in US).

  • Health systems must support healthy lifestyle

behaviors as they do for treatment

  • Care standards
  • Accountability
  • Liability
slide-12
SLIDE 12

12

  • Changes in lifestyle are difficult to sustain
  • Individual choices are the single most

important determinant of most persons’ health

  • Consistent messages, social and

environmental support, and strong commitment improve long-term results

  • Realistic expectations are necessary to
  • ptimize our health care
  • Individuals need credible information,

support and encouragement for behavior change, and the tools to achieve and maintain behavior change NOTE: They don’t get these things from the schools or from the health care system or from the government.

  • III. Changing System Behaviors

“Up to two decades may pass before the findings of original research become part of routine clinical practice.”

Translating Research Into Practice (TRIP)-II. Fact

  • Sheet. AHRQ Publication No. 01-P017, March 2001.

Health System Beliefs That Contribute to the Problem

  • Lifestyle issues aren’t the responsibility of

doctors; besides, they aren’t effective even when they try

  • Treating disease is more important than

preventing it

  • If someone is insured, they are entitled to

any care they want

  • To compete we must have all the latest

technology under our roof

1.Prioritize facilities and services to maximize benefit

  • 2. Reduce unnecessary care
  • 3. Reduce bureaucracy
  • 4. Practice evidence-based medicine – research

into practice

  • 5. Share risk – Cheap plans for the young and

healthy are incompatible with a viable health care system

  • 6. Be accountable for effective, evidence-based

preventive care

Education System Beliefs That Contribute to the Problem

  • Health behaviors are a trivial, boring part
  • f curriculum that deserve little serious

attention

  • Physical activity should be extracurricular;

students are here to learn, not exercise

  • People learn this stuff on their own or from

doctors; its not our responsibility

slide-13
SLIDE 13

13

  • Teach sound nutrition & physical

activity practices

  • Model sound nutrition & phsyical

activity practices:

  • Healthy, good tasting foods in

cafeteria and vending machines

  • Require fun physical activity

through all grades

Political System Beliefs That Contribute to the Problem

  • Corporations are entitled to “buy”

congressional support through campaign contributions

  • The US leads the world in health care; we

have nothing to learn from other nations

  • Health care reform is death to politicians;

avoid it

  • Single payer systems are “socialized

medicine” and, therefore are evil

  • Use scientific expertise to make policies

and laws

  • Eliminate special interest funding of political

campaigns

  • Look at the data and learn from other

nations that are doing it better

  • Demand health care reform--don’t vote for

politicians who avoid it

Health Industry Lobbying Contributions to Congress, 2006

50 100 150 200 250 300 350 400 2006 Pharm/hlt prod Hosp/Nrsg Hm Hlth Prof Hlth Serv/HMOs Other hlth Total Millions of dollars Source: The Center for Responsive Politics. http://www.opensecrets.org/lobbyists/indus.asp?Ind=H&cycle=2006

Health Industry Lobbying Contributions To Congress

Source: The Center for Responsive Politics. http://www.opensecrets.org/lobbyists/indus.asp?Ind=H&cycle=2006

  • Increase in lobbying contributions for health

since 1990: 456%

  • Amount given per congressional

candidate, 2006: $161,125

  • % that goes to keep incumbents incumbent

83%

  • % of 2006 money to:

Republicans 63 Democrats 37

A sound health care system requires legislative change. Special interest money distorts the legislative process so that these problems cannot be seriously addressed.

slide-14
SLIDE 14

14

Changes Must Occur to avoid health care collapse

Change Personal Health Syst Legislation Prioritize care X X X Unnecessary care X X X Bureaucracy X X Evidence-based Med X X X Return to shared risk X Special Interests X X X

A Challenge to Behavioral Researchers There is a large literature on changing personal behaviors. It’s difficult, but

  • possible. We need to apply this to

consumers in the health system. There is little literature on changing institutional behaviors. Both research and action are greatly needed here. Individuals, health systems, and legislators all must act if our health system is to survive and provide quality care to the entire population. Many oxen will be gored, and a lot of folks will resist the needed changes. The status quo is no longer an option.

Thank you

MAHALO