SLIDE 1
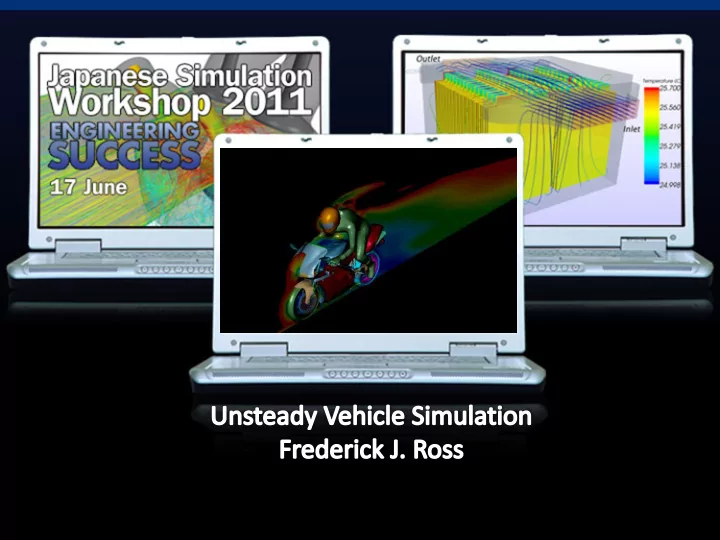
SLIDE 2 Unsteady Vehicle Simulation
– Steady State Advantages
- Quick turn-around time
- Proven accuracy in absolute values, and trends
Excellent tool for optimization studies to reduce drag.
– Proven to provide as accurate results for unsteady simulation, yet has lower hardware constraints, and significantly shorter turn-around (hours instead of days)
– Unsteady Advantages
- Certain drive conditions require unsteady simulation
» Vehicle Handling » Overtaking » Fleet Modeling
– Can improve aerodynamics by understanding the unsteady flow characteristics
» Aero-acoustics » Wheel Well Modeling » etc
DES Simulation ation
SLIDE 3 Unsteady Vehicle Simulation
Recommended Turbulence Model: SST (Menter) K-Omega Detached Eddy Simulation
– Time: 2nd order temporal solver (default is 1st order) – For wake flows, DES is more accurate than RANS. – Some publish studies have shown decent results with Spalart-Almaras.
- In-house studies still show K-Omega SST to be more accurate than Spalart-
Almaras solution.
– URANS does provide benefits when running thermal transient simulations
- Large time periods more critical then local flow structures.
DES Simulation ation
SLIDE 4 Biggest Disadvantage of Unsteady Simulation
Turn-around time
– Key reason why it would really be difficult getting F1 team to run unsteady simulation over steady since regulated by CPU hours.
Still, Several factors can help reduce overall turn-around
– Time Step
- Using Transient SIMPLE, time step can be increased significantly
– This is a blessing and curse » Allows for significantly faster turn-around time » Can be raised too high, that solution becomes un-physical.
– Inner Sweeps/Relaxation Factors
- Transient simulation can and should be run with higher relaxation factors then the
steady solution. The higher the relaxation factor, the few inner sweeps are needed.
– Grid density
- Grid density needs to be refined enough to capture local physics. Over refinement will
cause slow down in performance.
DES Simulation ation
SLIDE 5 Initializing The Solution
DES Sim imula lation ion
- To reduce run-time, transient simulations are
initiated using steady flow field.
– Using K-Omega SST to initialize the flow field helps reduce jump between steady and DES simulation – Current example uses couple solver. – The couple solver has possibility to reduce run-time for large models.
*The Segregated solver is recommended for transient simulation
– Faster per iteration – Converges the time step in fewer inner iterations
Size 60 million cells Steady Solution, 80 processors 20 hours DES Simulation, 128 Processors 3 Days
SLIDE 6 Time Step Size
- Resolving Length Scale Determines both on grid size and
time step
– First, the grid size needs to be fine enough to capture length scale. – Second, times step needs to match grid size and flow physics (convection speed)
Target for passenger cars have been to resolve wake of vehicles and tires. Small length scales have been shown to be less critical. This could change with a large front spoiler, or vehicles with large ground clearance.
DES Simulation ation
High Speed Aero Study
11 Vehicle Speed
140 kph
12 Length Scale
40 mm
13 Time Step
0.001 s Formula: =(C12/1000)/(C11/3.6)
SLIDE 7 Time Step Size: Checking Results
Convective Courant Number
– Detached regions should have courant number below 1. Regions on exterior, where flow is accelerating around corners, values above 1 do not seem to affect solution.
DES Simulation ation
Example shows excessively high current numbers around the passenger and front of the vehicle.
SLIDE 8 Time Step Influence
8 URANS t=0.001s URANS t=0.01s URANS t=0.0002s
Large time step show large wake fluctuation, and increase drag
SLIDE 9
Inner Sweeps/Relaxation Factors
Parameter Default Optimum Performance Practical Inner Sweeps 20 3 5-8 Velocity Relaxation Factor 0.7 0.9 0.8 Pressure Relaxation Factor 0.3 0.9 0.4
DES Simulation ation Relaxation Factors
– The default relaxation factors from the steady simulation can be increased when running unsteady. How high, really depends per case being examined. It is not typical for detail vehicle aerodynamics that relaxation factors can be raised above 0.8 for velocity, and 0.4 for pressure.
Inner Sweeps
– Default inner sweeps is 20 which is conservative. Most cases, 8 inner sweeps is significant to converge time step. Lowering inner sweeps between 3-5 help reduce turnaround time even further.
In-house experience with aerodynamics have shown lowering inner sweeps to speed up the solution is better than increasing time step. Large time step can significantly impact results.
SLIDE 10 Add Pressure Monitors For Inner Sweep Convergence
– Force on Vehicle – Pressure probes in tire/vehicle wake
Look for inner iterations to converge. May need to tighten scale to be able to see inner sweeps. 80% convergence to final value seems to be fine for Drag prediction. What we are seeing the change due to inner iteration convergence consistent direction with time. So even since we are seeing 10-15 inner iterations needed for good convergence, 5-8 may be fine for accurate drag
- predictions. Going to 10-15 just takes longer to achieve final drag values.
– Velocity Magnitude
Peak velocity should be below 150 m/s. If Higher, raising CdesTimeLim can improve stability
DES Simulation ation
SLIDE 11
Monitoring The Solution
DES Simulation ation
SLIDE 12 Relaxation/Inner Sweep Optimization
DES Simulation ation
At iteration 440, relaxation of pressure was raised to 0.7, inner iterations dropped to 10. Higher relaxation factors show faster convergence per time step. Fewer inner iterations reduce run time by 50%.
SLIDE 13 Inner Sweeps vs. Change in Time
DES Simulation ation
Fewer inner sweeps are used to speed up the time it takes for the flow field to fully develop.
For fast turn-around, the goal is to develop the flow as fast as
- possible. Too many inner sweeps really just delay the time it
takes to get to fully developed flow field
SLIDE 14 Grid Resolution: Useful Field Functions
Id Name Function Name Definition Purpose 1
Turbulent Length Scale TurbulentLengthScale
pow(.09,- .25)*sqrt($TurbulentKineticEnergy)/$Speci ficDissipationRate
Determines Turbulence Length scale for K-Omega SST model
2
Grid Size GridSize
pow($Volume,1.0/3.0)
Estimate Edge Length of cell (based upon cubes)
3
Length Ratio LengthRatio
$TurbulentLengthScale/(2*$GridSize)
To properly resolve turbulence, length ratio > 1 would be needed
DES Simulation ation
Grid Resolution
– Examining the results from the steady analysis can help determine grid resolution for DES simulation.
- The set of field functions are used to estimate the turbulent length scale,
based upon the turbulent dissipation. The grid size is estimated based upon the volume of each cell.
SLIDE 15
Sample of Field Functions Estimating Grid Size
DES Simulation ation Length Ratio = Turbulent Length Scale Grid Size
SLIDE 16 Effect Of Wake Refinement
DES Simulation ation
Overall drag value not real sensitive to the number of inner iteration. It has been seen that grid density, and refinement locations are more critical in getting accurate drag values.
13 million Cells 16 million Cells
SLIDE 17 Commercial Vehicle Example
similar results.
- All results with in tolerance of
expectation to wind tunnel measurements.
Accuracy within 1%!
DES Simulation ation
*Not actual truck used in study
SLIDE 18
Sample Result: DES Trend Studies
Results for multiple modifications to underbody.
DES Simulation of an SUV Number of Cells 160 million Number of CPUs 512 Turn-around Time 36 hours
2-Laye yer r Modeling Near Wall
SLIDE 19
Rigid Body Motion
DES Simulation ation
SLIDE 20
Rotating Reference Frame vs Rigid Body Motion Fan Test Rig Performance
Key factors in fan performance
– MRF can provide good results for fan performance but does depend on reference frame location. – Low flow rates, MRF has problems correctly getting pressure rise. – RBM does correlate better to in the transition zone, as well as the low flow rates. – RBM also improve thermal distribution at the outlet of the fan.
MRF Results
SLIDE 21 Influence of Inner Sweeps and Relaxation Factors: 4.5X Speed Up
DES Simulation ation
Optimum settings were seen using 5 inner sweeps, and Velocity/Pressure URF=0.8. With these settings, run time was roughly twice as long as the steady state results.
SLIDE 22 Rigid Body Motion Setup
– Initialize solution using steady, MRF solution – Enable unsteady solver – Switch from reference frame to a defined motion.
DES Simulation ation
SLIDE 23 Rigid Body Motion Setup
- Motion/Reference frames are
defined under “Tools” section.
DES Simulation ation
SLIDE 24 Vehicle Passing
- Setup for vehicle passing
is the same for rotating components.
– Motion is just defined as translation instead of rotation. – Studies are being done that include wheels rotating as vehicle passes. – Wake interaction important, hence DES simulation is recommended.
DES Simulation ation
SLIDE 25 Vehicle Passing
requires more complex grid motion.
– Studies have used rotating regions to aid in simulation of
– Mesh morphing has been used to change ride height. – Overlapping grids can simplify grid motion in the future.
DES Simulation ation
SLIDE 26 Sample Mesh Morphing Application
Roof Deflector
- This is an example where it is important
to run the mesh morpher as part of the unsteady analysis.
- Displacement exaggerated for
animation
- Displacement can be calculated
coupled to stress code, or using internal stress solver of STAR-CCM+ DES Simulation ation
SLIDE 27
- Unsteady simulation is being used today on production work.
– Results from unsteady simulations have shown good correlation with experimental data. – Reasonable turn-around times are being achieved
- It is important to understand the difference in settings between steady and
unsteady solver.
- It is important to properly choose time step appropriate to the desired physics being
solved.
– Rigid body motion can easily be defined and run. – Fluid solid interaction is being used coupled to mesh morphing to simulate displacement of parts. – In the future, overlapping grids will be available in STAR-CCM+ which will simplify complex motion.
Summary
DES Sim imula lation ion
SLIDE 28
Thank You
DES Sim imula lation ion