
SLIDE 1
1 1
Understanding Patterns of Understanding Patterns of TCP Connection Usage TCP Connection Usage with Statistical Clustering with Statistical Clustering
The The UNIVERSITY UNIVERSITY of
- f NORTH CAROLINA
NORTH CAROLINA at at CHAPEL HILL CHAPEL HILL
http://www.cs.unc.edu/Research/dirt
Félix Hernández-Campos Félix Hernández-Campos Kevin Jeffay Kevin Jeffay Don Smith Don Smith
Department of Computer Science Department of Computer Science
Andrew Nobel Andrew Nobel
Department of Statistics Department of Statistics
2 2
Motivation Motivation
Modeling Internet Traffic Modeling Internet Traffic
INTERNET
3 3
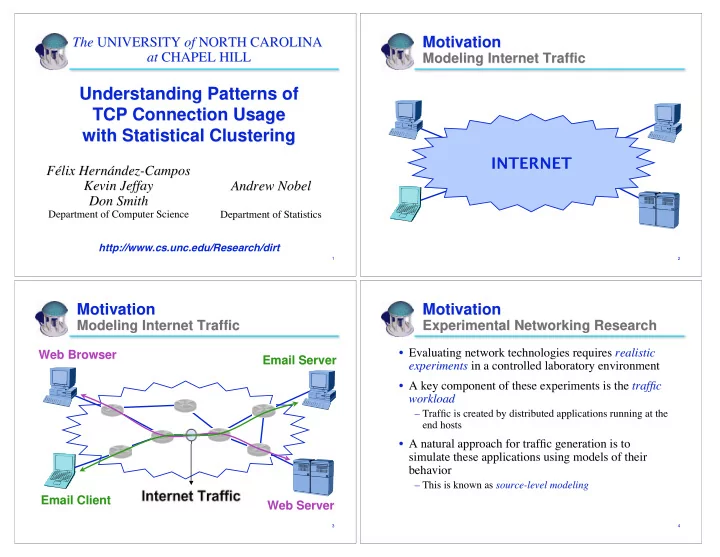
Motivation Motivation
Modeling Internet Traffic Modeling Internet Traffic Internet Traffic
Web Browser Web Browser Web Server Web Server Email Server Email Server Email Client Email Client
4 4
Motivation Motivation
Experimental Networking Research Experimental Networking Research
- Evaluating network technologies requires
Evaluating network technologies requires realistic realistic experiments experiments in a controlled laboratory environment in a controlled laboratory environment
- A key component of these experiments is the
A key component of these experiments is the traffic traffic workload workload
– – Traffic is created by distributed applications running at the Traffic is created by distributed applications running at the end hosts end hosts
- A natural approach for traffic generation is to