
SLIDE 1
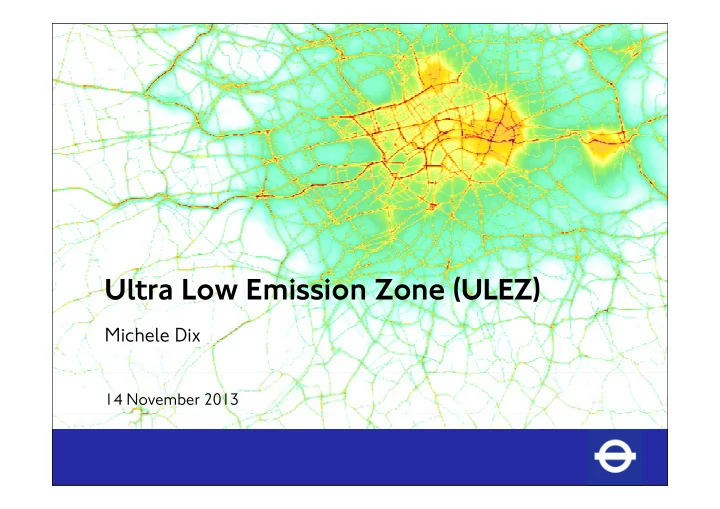
Ultra Low Emission Zone (ULEZ) Michele Dix 14 November 2013 - - PowerPoint PPT Presentation
Ultra Low Emission Zone (ULEZ) Michele Dix 14 November 2013 Contents Challenges and existing policies ULEZ ULEZ Objectives and purpose Identifying and refining potential policies y g g p p Assessing the options
2
3
Mayor’s Transport Strategy Mayor’s Climate Change Mitigation d E St t Mayor’s Air Quality Strategy
4
Mayor s Transport Strategy and Energy Strategy Mayor s Air Quality Strategy
5
2020 NO2 Annual Mean (µgm-3 )
Greatest amount of public exposure to air pollutants and highest amount of
(µg )
roadside activity occurs in central London
EU limit
6
– Roads Task Force – Cycling Vision, including cycle safety – Walking – West End – Mayor’s 2020 Vision – Freight – Taxis Tourist Bus Action Plan – Tourist Bus Action Plan
– The Mayor’s Air Quality Strategy y y gy – Transport Emissions Action Plan; and – The Mayor’s Low Emission Vehicle Road Map
– Government – EU Boroughs – Boroughs
7
8
9
22% 5% 19% 33% 14% 9%
46% 8% 5% 22% 46% 22%
27% 35%
20% 40% 8% 10% 19% 18% 9% 13%
10
2
17% 37% 24% 53% 11% 11% 37% 11%
9% 18% 11%
11
12
13
14
15
16
17
7 00 18 00 M F i ( bli
7:00 – 18:00 Mon-Fri (exc public holidays)
18
*taken from sensitivity scenarios, assumes like-for-like travel behaviour and 100% compliance
19
100% 80% 90% 100% 60% 70% et Euro 6 / VI Taxi Petrol Car (national fleet) Diesel Car (national fleet) 40% 50% entage of the flee Diesel Car (national fleet) Petrol LGV Diesel LGV TfL Buses Coaches and non-TfL Buses 10% 20% 30% Perce Rigid HGV Articulated HGV
NB: Car percentages based
0% 10% 2014 2015 2016 2017 2018 2019 2020 2021 2022 2023 2024 2025 2026 2027 2028 2029 2030
and central London profile likely to differ. Cars includes PHVs. Others based on estimates
20
from London ANPR and TfL audit data
21
22
Number of unique vehicles entering at least once a month
Cars/PHV/P2W 800,000 Vans 167 ,000
HGVs 31,000 Non TfL buses & coaches 16,000
coaches Taxis 21,000 * Buses 2,700 * London wide licences
23
Adaptations may lead to less traffic in zone but also less benefits outside zone
24
Adaptations may lead to less traffic in zone but also less benefits outside zone. Adaptations may also incur dis-benefits (eg inconvenience)
25
26
1,200
B li i i
600 800 1,000 nnes NOx Articulated HGV
S ensitivity/ benchmarks Baseline emissions Packages
200 400 600 Annual Ton Articulated HGV Rigid HGV Coach and non-TfL Bus TfL Bus Diesel LGV Petrol LGV
NOx (tonnes per annum)
Euro 6 CC hours Zero Emission CC hours Euro 6 24/7 Zero Emissions 24/7 BAU Moderate High V.High estimate Diesel Car Petrol Car Taxi Motorcycle
x
p in 2020, set against benchmarks and trajectory (June 2013)
27
2010 2020 2030
*taken from sensitivity scenarios, assumes like-for-like travel behaviour and 100% compliance
28
29
Link to the ULEZ briefing to the London Assembly Environment Committee in July: http://www.london.gov.uk/sites/default/files/ULEZ%20scrutiny%20briefing%20- %20July%202013.pdf y p
30