SLIDE 30 (1) (2) (3) (4) (5) (6) Unemployment rate gap
0.03
0.03
(0.01) (0.03) (0.02) (0.05) (0.02) (0.06) Coefficient on unemployment rate gap interacted with indicator variables for: Age (16-24 is omitted group): Age 25-34
0.09 (0.02) (0.04) (0.04) Age 35-44
0.11 (0.05) (0.07) (0.08) Age 45-54
0.00 0.27 (0.04) (0.06) (0.08) Age 55-64 0.04 0.02 0.33 (0.04) (0.06) (0.07) Age 65+
0.36 (0.04) (0.06) (0.07) Race (White is omitted group): Black
0.42 (0.04) (0.05) (0.07) Hispanic 0.13 0.08
(0.04) (0.05) (0.08) Other 0.22 0.62
(0.31) (0.47) (0.61) Education (at most high school degree is omitted group): Some college or more 0.10 0.24 0.04 (0.07) (0.10) (0.12) Sex (male is omitted group): Female
0.04 (0.02) (0.03) (0.04) Homeownership status (owner is omitted group): Renter
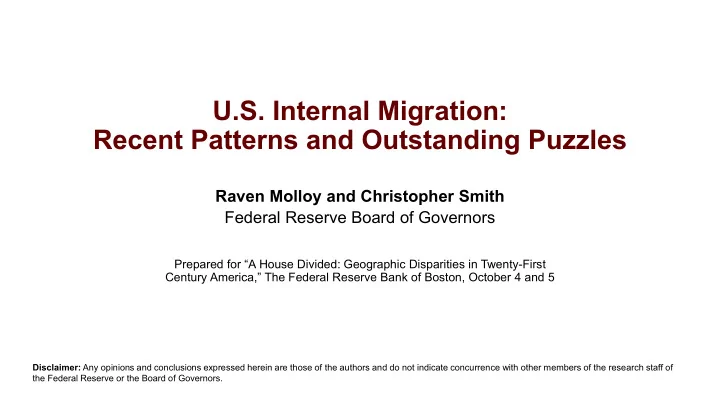
(0.03) (0.05) (0.06) Cross-state Cross-state or cross- county Within county Dependent variable: Dummy variable for whether respondent (16+) moved indicated location in previous year (x 100)
Note: Each column presents the coefficient on the unemployment rate gap (standard error in parentheses) for a separate
- regression. All regressions are estimated at the individual level for the 16+ population, use CPS ASEC surveys from 1980-
2017, and have an observation count of 2,743,808. Regressions in columns (1), (3), and (5) only include the national unemployment rate gap and a linear time trend as covariates. Regressions in columns (2), (4), and (6) include dummy variables for the age, race, education, sex, and homeownership groups as listed in the table; dummies for the demographic groups interacted with the national unemployment rate gap; and group-specific time trends. The coefficient on the unemployment rate gap interactions are provided for each group.