
1
http://www.school-for-champions.com/science/static_materials.htm
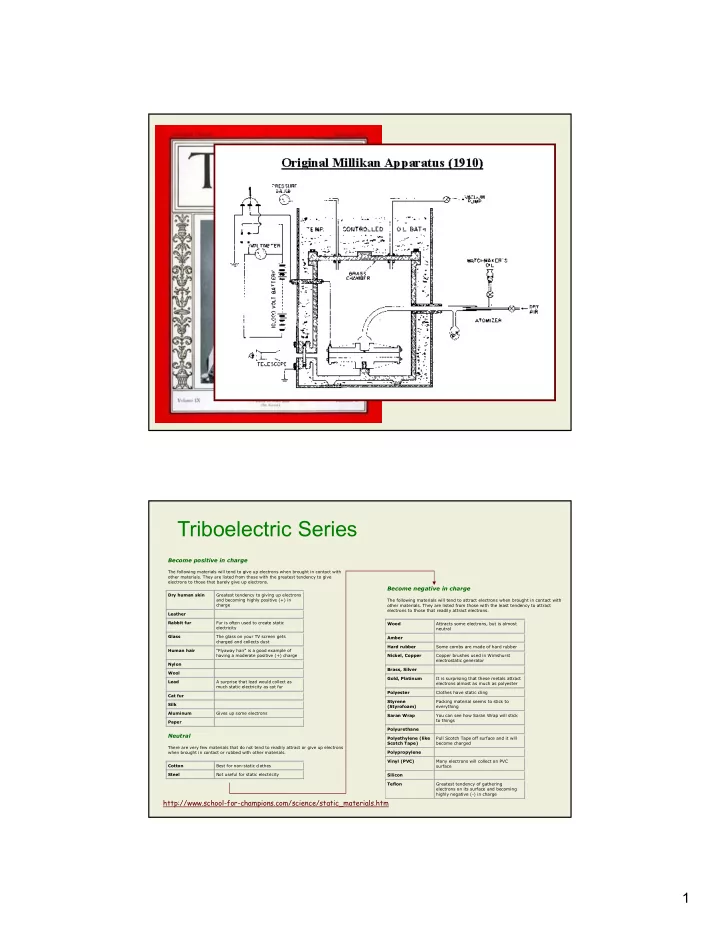
Become positive in charge
The following materials will tend to give up electrons when brought in contact with
- ther materials. They are listed from those with the greatest tendency to give
electrons to those that barely give up electrons. Dry human skin Greatest tendency to giving up electrons and becoming highly positive (+) in charge Leather Rabbit fur Fur is often used to create static electricity Glass The glass on your TV screen gets charged and collects dust Human hair "Flyaway hair" is a good example of having a moderate positive (+) charge Nylon Wool Lead A surprise that lead would collect as much static electricity as cat fur Cat fur Silk Aluminum Gives up some electrons Paper
Neutral
There are very few materials that do not tend to readily attract or give up electrons when brought in contact or rubbed with other materials. Cotton Best for non-static clothes Steel Not useful for static electricity
Become negative in charge
The following materials will tend to attract electrons when brought in contact with
- ther materials. They are listed from those with the least tendency to attract
electrons to those that readily attract electrons. Wood Attracts some electrons, but is almost neutral Amber Hard rubber Some combs are made of hard rubber Nickel, Copper Copper brushes used in Wimshurst electrostatic generator Brass, Silver Gold, Platinum It is surprising that these metals attract electrons almost as much as polyester Polyester Clothes have static cling Styrene (Styrofoam) Packing material seems to stick to everything Saran Wrap You can see how Saran Wrap will stick to things Polyurethane Polyethylene (like Scotch Tape) Pull Scotch Tape off surface and it will become charged Polypropylene Vinyl (PVC) Many electrons will collect on PVC surface Silicon Teflon Greatest tendency of gathering electrons on its surface and becoming highly negative (-) in charge