Treasury Oversight Committee November 8, 2019 City Hall - Room 140 - - PowerPoint PPT Presentation

treasury oversight committee
SMART_READER_LITE
LIVE PREVIEW

Treasury Oversight Committee November 8, 2019 City Hall - Room 140 - - PowerPoint PPT Presentation

Office of the Treasurer & Tax Collector City and County of San Francisco Jos Cisneros, Treasurer Tajel Shah, Chief Assistant Treasurer Robert L. Shaw, CFA, Chief Investment Officer Treasury Oversight Committee November 8, 2019 City Hall


slide-1
SLIDE 1

Treasury Oversight Committee

November 8, 2019

Office of the Treasurer & Tax Collector City and County of San Francisco

Tajel Shah, Chief Assistant Treasurer Robert L. Shaw, CFA, Chief Investment Officer

José Cisneros, Treasurer

City Hall - Room 140 ● 1 Dr. Carlton B. Goodlett Place ● San Francisco, CA 94102-4638 Telephone: 415-554-5210 ● Facsimile: 415-554-5660

slide-2
SLIDE 2

Table of Contents

Economic & Market Overview Strategy The Economic Outlook Pooled Fund Review Pool Participants Breakdown Appendix A October Monthly Report 2019 3-5 6-8 9-13 14-17 18-19 20-24 Separate handout

2

slide-3
SLIDE 3

Source: Bloomberg

Key Economic Data

3

0% 2% 4% 6% 8% 10% 12% 62% 63% 64% 65% 66% 9/09 9/11 9/13 9/15 9/17 9/19

Wage Growth & Unemployment Rate Labor Participation Rate

Employment

Wage Growth Labor Participation Rate Unemployment Rate

38 41 44 47 50 53 56 59 62

  • 1%

0% 1% 2% 3% 4% 9/15 9/16 9/17 9/18 9/19

Gross Domestic Product

GDP Year-over-Year Change ISM Manufacturing PMI ISM Non-Manufacturing PMI

  • 1.5%
  • 0.5%

0.5% 1.5% 2.5% 3.5% 9/15 9/16 9/17 9/18 9/19

Producer Price Index vs Consumer Price Index

Core CPI Core PPI CPI PPI

0K 1,000K 2,000K 3,000K 4,000K 5,000K 6,000K 7,000K 8,000K 9,000K 0K 100K 200K 300K 400K 500K 600K

8/09 8/11 8/13 8/15 8/17 8/19

JOLTS & Jobless Claims

US Initial Jobless Claims US Job Openings

slide-4
SLIDE 4

0K 100K 200K 300K 400K 500K 600K 700K 800K

1 2 3 4 5 6 7 9/09 9/10 9/11 9/12 9/13 9/14 9/15 9/16 9/17 9/18 9/19 Millions

Housing

Existing Homes Sales New Home Sales

Source: Bloomberg

Key Economic Data

4

100 150 200 250 300 8/09 8/10 8/11 8/12 8/13 8/14 8/15 8/16 8/17 8/18 8/19

S&P/Case-Shiller Home Price Indices

20 Metro Composite San Francisco Area

slide-5
SLIDE 5

Yield Curve Changes

5

1.2% 1.3% 1.4% 1.5% 1.6% 1.7% 1.8% 1.9% 2.0% 2.1% 2.2%

3M 1Y 2Y 3Y 5Y

UST Yield Curve as of 6/28/2019 UST Yield Curve as of 8/23/2019 UST Yield Curve as of 11/4/2019

Source: Bloomberg

UST Yields 8/23/19 11/1/19 Change 3M 1.95 1.51

  • 0.45

6M 1.86 1.54

  • 0.32

1Y 1.72 1.53

  • 0.19

2Y 1.53 1.60 0.06 3Y 1.45 1.60 0.14 5Y 1.42 1.60 0.18

slide-6
SLIDE 6

Strategic Considerations

Policy Issues:

  • Monetary –Rate Cuts remain policy:
  • 10/30/2019: Cut by 0.25% - 3rd Cut since December 2008; and
  • 2019 Rate Decrease Probability:
  • 4th Rate Cut Probability is 16% (December 2019);
  • Fiscal:
  • Tax Reform – No Change:
  • Corporate. Buybacks remain focus;
  • Repatriation of Earnings, but not investing in factories /

jobs in US; and

  • Individual. One-time Bonus, not Pay Raises.
  • Tariffs: Little shifting of production to United States; and
  • Trade: The New NAFTA, China and Europe.

6

slide-7
SLIDE 7

Strategic Considerations

Government Policy Issues:

  • Federal Reserve’s Balance Sheet - $4.5 Trillion (Fall 2017):
  • $4.0 Trillion (October 2019);
  • Up from $3.8 Billion in July;
  • Not being called Quantitative Easing

7

slide-8
SLIDE 8

Strategic Considerations

Portfolio Issues:

  • Inflows:
  • August: Airport ($957 Million); and
  • October: CCSF ($97 Million)
  • Use Money Market Sector to Satisfy Liquidity Needs
  • Portfolio Duration: 0.64 (Sept 2019):
  • 0.99 December 2018;
  • 0.95 in December 2017; and
  • 0.68 in December 2016.
  • Duration is an Outcome, not an Objective. Approach is:
  • Purchasing Securities that mature on (or slightly before) a known need –

such as Payroll, Debt Service, Capital Projects, etc.; and

  • Opportunistic Investing.

8

slide-9
SLIDE 9

The Economic Outlook Goldilocks Zone – Still There Counterpunching:

  • Labor participation rate is range bound – despite the large number of job opening;
  • Asset prices (such as US Equities) have been very volatile over the past year;
  • Interest Rates: Shifted quickly from Increases to Decreases;
  • GDP: The best positive among the factors – but declining; and
  • Average Hourly Earnings remains above 3.0%.

9

Factor Current Situation Low unemployment rate 3.5% (50 Year Low) Increasing asset prices (stocks, real estate, etc.); S&P 500 (+15.8% - since 2009 Trough) Low Interest rates; Below historical norms & falling Brisk but steady GDP growth; and > 2.5% past several years Low inflation Low (1.7%) & below target

slide-10
SLIDE 10

Future Rate Changes

Moving into the inflection zone:

  • Fed Funds: 1.20% - 1.75% Range;
  • +1.75% (9 Rate Increases & 3 Decrease since December 2015);
  • Fed Minutes: Disagreement amount members on Direction;
  • Forecast is a <20% chance of 1 More rate Decrease in 2019; and
  • Forecast (Fed Dot Plot):
  • September 2018: Target Range was 3.25% - 3.50%;
  • December 2018: Target Range now 3.00% - 3.25%;
  • March 2019: Target Range was 2.50% - 2.75%;
  • Sept. 2019: Target Range now 2.50% - 2.75%;

Pool Impact:

  • Yield Curve is Flat / Inverted between 2 years (1.59%) and 5 years

(1.60%)

  • Makes longer dated bonds less attractive.

10

slide-11
SLIDE 11

Yield Curve Inversions & Recessions

11

?

Date of inversion Start of recession Number of months 9/17/1978 1/2/1980 15.5 9/12/1980 7/1/1981 10 8/11/1989 7/1/1990 11 2/2/2000 3/1/2001 13 2/1/2006 12/1/2007 22 8/31/2019 ? ?

slide-12
SLIDE 12

The Dot Plot – September 2019

12

slide-13
SLIDE 13

13

The Dot Plot – December 2018

slide-14
SLIDE 14

Historical Maturity Distribution Comparison

14 0% 10% 20% 30% 40% 50% 0 TO 1 MONTHS 1 TO 3 MONTHS 3 TO 6 MONTHS 6 TO 12 MONTHS 12 TO 24 MONTHS 24 TO 36 MONTHS 36 TO 48 MONTHS 48 TO 60 MONTHS

Maturity Distribution

9/30/2018 9/30/2019

Source: SunGard APS2

0% 10% 20% 30% 40% 50% 0 TO 1 MONTHS 1 TO 3 MONTHS 3 TO 6 MONTHS 6 TO 12 MONTHS 12 TO 24 MONTHS 24 TO 36 MONTHS 36 TO 48 MONTHS 48 TO 60 MONTHS

Effective Maturity Distribution

9/30/2018 9/30/2019

slide-15
SLIDE 15

17.4% 5.8% 9.7% 8.7% 51.5% 53.7% 49.0% 48.7% 3.7% 3.6% 1.9% 0.8% 10.6% 17.2% 19.6% 23.2% 5.3% 10.2% 7.0% 6.6% 1.6% 0.8% 1.0% 0.3% 9.2% 4.5% 4.4% 6.3% 0.7% 4.1% 7.3% 5.0%

  • 750

1,500 2,250 3,000 3,750 4,500 5,250 6,000 6,750 7,500 8,250 9,000 9,750 10,500 11,250 12,000

9/30/2016 9/30/2017 9/30/2018 9/30/2019

$ Millions

Supranationals Money Market Funds Medium Term Notes Commercial Paper Banker's Acceptances Negotiable CDs Public Time Deposits State/Local Agencies TLGP Federal Agencies U.S. Treasuries

15

Portfolio Comparison

Source: SunGard APS2

slide-16
SLIDE 16

Portfolio Comparison

16

FIXED 77% FLOAT 20% STEP CPN 3% FIXED 94% FLOAT 5% STEP CPN 1%

Source: SunGard APS2

September 30, 2018 September 30, 2019

slide-17
SLIDE 17

Name of Fund

Portfolio Size* ($ mns)

Los Angeles County $27,584.0 LAIF 24,268.6 City and County of San Francisco 10,639.3 San Diego County 8,637.8 Riverside County 6,525.7 San Bernardino County 6,240.0 Orange County (ex. Schools) 3,754.3 Fresno 3,572.0 Sacramento County 3,458.7 Contra Costa County 2,484.6 Sonoma County 2,208.9

LGIP Index 30-Day Gross Yield September 2013 – September 2019

County Pooled Fund Statistics

17

Sources: Bloomberg, Sacramento County as of 10/21/2019

* as of August 2019

0.0% 0.5% 1.0% 1.5% 2.0% 2.5% Sep 13 Sep 14 Sep 15 Sep 16 Sep 17 Sep 18 Sep 19 San Francisco Earned Income Yield LGIP Index 30-Day Gross Yield

SF Sac Fresno County LAIF Los Angeles County Orange County Riverside SB SD Sonoma Contra Costa 1.4% 1.6% 1.8% 2.0% 2.2% 2.4% 2.6% 50 100 150 200 250 300 350 400 450 500 550 600 650 700 750 800 850 900 Monthly Change In Earned Income Yield

Weighted Average Maturity (in days)

Aug 31, 2018 Aug 30, 2019 Nov 4, 2019

slide-18
SLIDE 18

18

Pool Participants Breakdown

As of September 2019

Pool Participant Fund Balance Percent of Fund

General Fund/Special City Funds/Internal Services Funds $4,022,743,111 35.92% San Francisco International Airport 2,563,276,898 22.89% San Francisco Public Utilities Commission 1,389,004,684 12.40% San Francisco Municipal Transportation Authority 794,531,244 7.09% Facilities and Capital Projects Funds - General 568,921,176 5.08% San Francisco Unified School District 528,669,920 4.72% San Francisco General Hospital and Laguna Honda Hospital 330,882,940 2.95% Other agencies (incl. Transbay Joint Powers, Trial Courts) 305,918,959 2.73% OCII - Successor Agency – former SFRDA 273,333,290 2.44% Port of San Francisco 204,591,739 1.83% San Francisco Community College District 87,132,350 0.78% San Francisco County Transportation Authority 82,575,922 0.74% Pension and Retiree Health Care Trust Fund 48,296,245 0.43%

Totals

$11,199,878,480 100.0%

Sources: FSP Impromptu

slide-19
SLIDE 19

19

Source: 2006 – 2019 Ending Balance Cognos and FSP Impromptu

September 30, 2006 – September 30, 2019

Pool Participants Trends

2 4 6 8 10 12 2006 2007 2008 2009 2010 2011 2012 2013 2014 2015 2016 2017 2018 2019

Billions

General Fund/Special City Funds/Internal Services Funds San Francisco International Airport San Francisco Public Utilities Commission Other San Francisco Municipal Transportation Authority Facilities and Capital Projects Funds - General San Francisco General Hospital and Laguna Honda Hospital San Francisco Unified School District

slide-20
SLIDE 20

Appendix A

20

Cash Flow Model Outline – How it was developed

  • 1. Daily CF Data extracted from CashPro (BofA) for prior (FY19) Fiscal Year;
  • 2. Outflow (aka, Spending) data aggregated to Biweekly payroll cycle;
  • 3. Adjust for known & recurring outflows:

a) Payroll; b) Payroll Taxes; c) Kaiser medical payment; d) Debt Service (CCSF, PUC, SFO, OCII, etc.); e) Pension payments; and f) Airport Capital Spending.

  • 4. Result is a “Baseline” for spending that can be projected forward for the next Fiscal

Year;

slide-21
SLIDE 21

Appendix A

21

Cash Flow Model Outline – How it was developed

  • 5. Introduce a “growth factor” for baseline spending, payroll, payroll taxes, Kaiser

and monthly pension payment to reflect contractual increases and general

  • inflation. Currently modeled at 3%;
  • 6. Add Debt Service, SFO Capital Spending and annual Pension Contribution based
  • n information provided;
  • 7. Result is a forecast of Gross CCSF outflows;
  • 8. Subtract known Investment Pool Maturities;
  • 9. Result: Cash Flow Shortfall (or Surplus);
slide-22
SLIDE 22

Appendix A

22

Cash Flow Model Outline – How it was developed

  • 10. Add in anticipated Inflows:
  • a. Based on prior FY actuals;
  • b. Adjusted for one-time (Bond Issuance) Inflows; and
  • c. Include a Growth Factor to reflect inflation.

End Result

  • A. Estimate of the Biweekly Cash Flow Deficit or Surplus; and
  • A. Opportunity to identify significant Deficits or Surpluses that could be reduced

through better portfolio management.

slide-23
SLIDE 23

Appendix A

23

TTX Cash-Flow Actuals

Gross Expenditures Modeled Spending Baseline 7/10/2018 980,528,780 (864,516,561) 116,012,219 7/24/2018 455,683,117 (237,856,799) 217,826,318 8/7/2018 635,951,045 (287,885,475) 348,065,570 8/21/2018 379,844,576 (242,866,309) 136,978,267 9/4/2018 433,589,686 (251,200,339) 182,389,348 9/18/2018 602,881,038 (282,795,078) 320,085,961 10/2/2018 602,551,877 (292,144,155) 310,407,722 10/16/2018 421,759,797 (163,427,196) 258,332,601 10/30/2018 701,567,519 (481,062,203) 220,505,316 11/13/2018 517,856,971 (253,268,038) 264,588,933 11/27/2018 492,812,284 (292,698,328) 200,113,956 12/11/2018 671,097,295 (253,186,706) 417,910,589 12/24/2018 561,787,698 (371,415,218) 190,372,480 1/8/2019 654,138,238 (218,000,000) 436,138,238 1/22/2019 504,508,232 (381,216,762) 123,291,469 2/5/2019 401,309,382 (218,000,000) 183,309,382 2/19/2019 619,879,229 (329,891,350) 289,987,879 3/5/2019 618,057,419 (254,737,519) 363,319,900 3/19/2019 618,311,097 (316,068,853) 302,242,243 4/2/2019 658,906,383 (272,836,890) 386,069,493 4/16/2019 494,677,196 (271,490,236) 223,186,960 4/30/2019 653,789,113 (306,134,279) 347,654,834 5/14/2019 484,807,880 (253,109,787) 231,698,093 5/28/2019 479,223,923 (294,329,918) 184,894,005 6/11/2019 504,169,772 (253,067,087) 251,102,685 6/25/2019 1,299,192,836 (848,235,491) 450,957,345 6/30/2019 114,993,048 114,993,048 15,563,875,431 (8,491,440,577) 7,072,434,854

slide-24
SLIDE 24

Appendix A

24

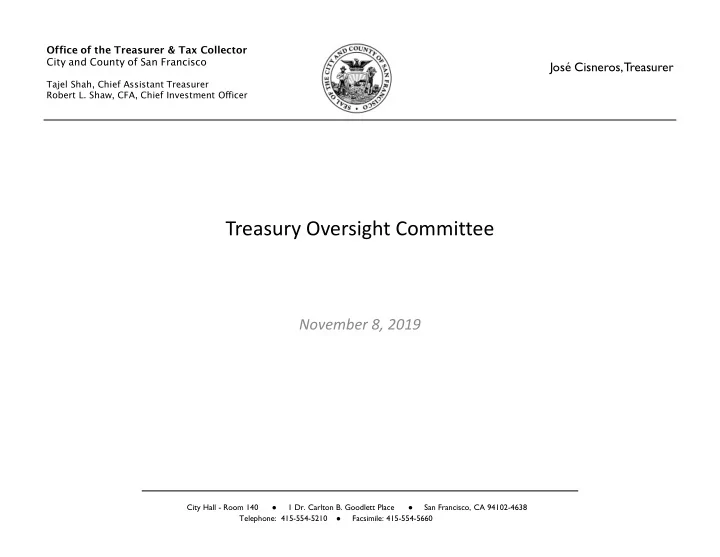
Baseline Expenses subject to Growth Debt Service Other Gross Expenditures Known Bond Maturities Un Covered Expenses Projected InFlows Cash-Flow Surplus / (Deficit) 7/9/2019 116,012,219 264,424,251 706,102,000 1,086,538,470 926,011,000 160,527,470 131,680,387 28,847,083 7/23/2019 217,826,318 133,760,000 118,221,297 469,807,615 175,000,000 294,807,615 255,768,851 39,038,764 8/6/2019 348,065,570 264,218,656 35,044,656 647,328,882 451,010,000 196,318,882 505,191,023 (308,872,141) 8/20/2019 136,978,267 133,760,000 115,053,326 385,791,593 300,000,000 85,791,593 202,006,790 (116,215,196) 9/3/2019 182,389,348 227,810,000 33,200,339 443,399,686 193,450,000 249,949,686 365,568,283 (115,618,597) 9/17/2019 320,085,961 169,804,671 115,087,752 604,978,383 344,716,000 260,262,383 147,385,885 112,876,499 10/1/2019 310,407,722 227,810,000 74,144,155 612,361,877 361,500,000 250,861,877 462,646,689 (211,784,811) 10/15/2019 258,332,601 170,781,420 429,114,021 221,000,000 208,114,021 243,592,999 (35,478,978) 10/29/2019 220,505,316 133,760,000 225,895,311 107,966,929 688,127,556 389,800,000 298,327,556 479,579,985 (181,252,429) 11/12/2019 264,588,933 264,665,099 529,254,032 259,650,000 269,604,032 401,031,300 (131,427,267) 11/26/2019 200,113,956 133,760,000 35,134,712 85,543,459 454,552,127 183,950,000 270,602,127 347,159,758 (76,557,631) 12/10/2019 417,910,589 264,580,108 682,490,697 300,000,000 382,490,697 823,427,530 (440,936,833) 12/24/2019 190,372,480 133,760,000 110,221,517 79,683,097 514,037,094 121,360,000 392,677,094 225,674,257 167,002,837 1/7/2020 436,138,238 227,810,000 663,948,238 125,000,000 538,948,238 487,879,923 51,068,315 1/21/2020 123,291,469 170,676,406 55,867,535 89,976,589 439,811,999 147,295,000 292,516,999 210,534,888 81,982,111 2/4/2020 183,309,382 227,810,000 411,119,382 190,000,000 221,119,382 538,147,683 (317,028,302) 2/18/2020 289,987,879 169,804,587 75,914,414 535,706,879 200,000,000 335,706,879 148,416,206 187,290,673 3/3/2020 363,319,900 227,810,000 36,737,519 627,867,419 250,000,000 377,867,419 921,270,147 (543,402,728) 3/17/2020 302,242,243 170,592,860 80,299,392 553,134,496 15,710,000 537,424,496 305,700,316 231,724,180 3/31/2020 386,069,493 227,810,000 54,836,890 668,716,383 170,000,000 498,716,383 679,978,409 (181,262,026) 4/14/2020 223,186,960 170,518,949 108,314,209 502,020,118 65,000,000 437,020,118 559,099,823 (122,079,705) 4/28/2020 347,654,834 133,760,000 37,441,068 114,288,102 633,144,004 125,000,000 508,144,004 587,450,036 (79,306,031) 5/12/2020 231,698,093 264,499,727 496,197,820 58,995,227 437,202,593 230,808,998 206,393,596 5/26/2020 184,894,005 133,760,000 32,426,378 115,521,666 466,602,049 15,750,000 450,852,049 218,561,562 232,290,487 6/9/2020 251,102,685 264,455,106 515,557,791 515,557,791 407,770,488 107,787,302 6/23/2020 450,957,345 133,760,000 591,808,420 115,419,028 1,291,944,793 251,900,000 1,040,044,793 432,100,455 607,944,338 6/30/2020 114,993,048 114,993,048 14,675,000 100,318,048 396,206,284 (295,888,236) 7,072,434,854 5,045,961,839 1,431,072,708 1,919,077,051 15,468,546,453 5,856,772,227 9,611,774,226 10,714,638,953 (1,102,864,728)

TTX Cash-Flow Forecasting Model