
SLIDE 1
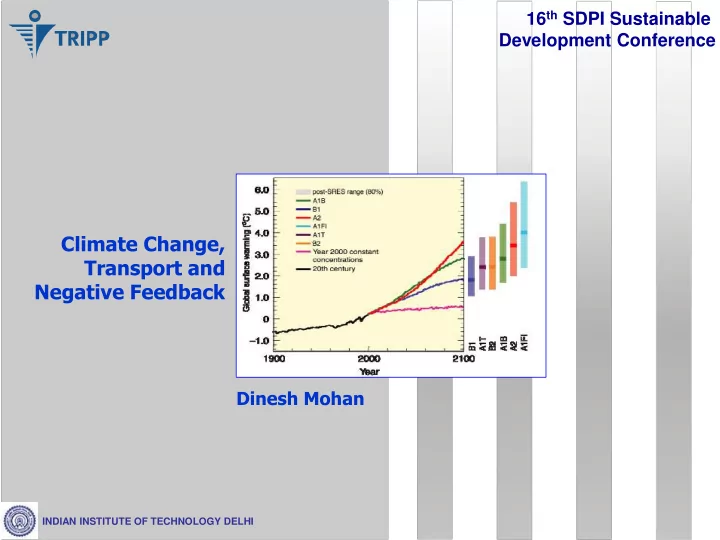
Climate Change, Transport and Negative Feedback
Dinesh Mohan
INDIAN INSTITUTE OF TECHNOLOGY DELHI
16th SDPI Sustainable Development Conference
Transport and Negative Feedback Dinesh Mohan INDIAN INSTITUTE OF - - PowerPoint PPT Presentation
16 th SDPI Sustainable Development Conference Climate Change, Transport and Negative Feedback Dinesh Mohan INDIAN INSTITUTE OF TECHNOLOGY DELHI POLITICS OF CO2 India rich India middle class 2050 India poor Poor have to increase energy
Climate Change, Transport and Negative Feedback
Dinesh Mohan
INDIAN INSTITUTE OF TECHNOLOGY DELHI
16th SDPI Sustainable Development Conference
India poor India middle class India rich
Rich and middle class must reduce energy consumption Poor have to increase energy consumption 2050
20 January 2014
0.00 0.10 0.20 0.30 0.40 0.50 0.60 0.70 0.80 2010 BAU Lower Carbon Driving Active Travel Combination
(In collaboration with London School of Hygiene and Tropical Medicine)
Woodcock etc al, Lancet
3
IIT Delhi 20-01-2014
4
We can best improve global health by making sure that walking, bicycling and use of public transport are the dominant modes of travel for people in urban areas. This will only be possible if we strive to make
perceive walking and cycling and their urban environment more generally to be safe…………………..…………………(Roberts, I. 2012, UK) There is an urgent need for the linking-up of transport planning and urban design, public health and transport safety, well-being and the built environment…(Risom, J. 2012, Denmark) At the design level, design of road infrastructure (road cross section, carriageway width, intersection design), facilities for pedestrians, bicycles and public transport users influence the behaviour of road users……………………………………………………….(Tiwari, G. 2012, India)
Jeff Risom
IIT Delhi 20-01-2014
5
Evidence from India, South Africa, South America, North America and Europe indicates that both children and adults are concerned about traffic safety and crime on the streets and in public transport facilities. This influences their decision whether to walk, bicycle or use public transport…………………………..........................…(Appleyard, B. 2012, USA) Integrated urban planning is needed to better address crime and violence, and to create communities that support active transportation and therefore reduce driving and climate change….(Cohen, L. 2012, USA)
From that viewpoint, pedestrian flow spaces should be designed first according to human environmental needs such as safety perception; later, vehicles should be incorporated, as well as other means of transportation, but subordinated to the environmental experience of pedestrians……………………………………………...(Vargas, M. 2012, Chile)
Dunu Roy
IIT Delhi 20-01-2014
6
Many transportation policies aimed at motorised vehicles fail to pay attention to their impacts on poverty and social exclusion. They neglect the access and transportation demands of the more economically disadvantaged groups
society, who rely mostly
public transportation, walking, and cycling…….....(Villaveces, A. 2012, Colombia) it is clear from the child independent and scholar travel data that if walking is to be promoted amongst children, safer environments are
believe that the same would not apply to encouraging adult pedestrians as well…(Behrens, R. 2012, South Africa) Studies performed in various European and North American countries clearly show that personal safety is a determinant factor in a person’s decision whether or not to use public transport…….(Cardia, C. 2012, Italy)
Jeff Risom
IIT Delhi 2013
10 20 30 40 50 60 Time, miniutes 5 10 15 20 25 30 Time, minutes
10 20 30 40 50 60 70 80 90 100 Time, minutes
5 10 15 20 25 30 35 40 45
Time, minutes
Walking to station/veh Walking in station - in Waiting at station Journey in vehicle Walking in station - out Walking to destination Congestion (car) One change
CAR CAR CAR CAR BICYCLE BICYCLE WALK
3 KM 6 KM 12 KM 24 KM
DOOR TO DOOR TRIP TIMES
ELEVATED/ UNDERGRND PT ELEVATED UNDERGRND PT ELEVATED UNDERGRND/ PT SURFACE PT SURFACE PT SURFACE PT SURFACE PT ELEVATED UNDERGRND PT
Source: Mikhail Chester and Arpad Horvath 2008 Environmental Life-cycle Assessment of Passenger Transportation: A Detailed Methodology for Energy, Greenhouse Gas, and Criteria Pollutant Inventories of Automobiles, Buses, Light Rail, Heavy Rail and Air. WORKING PAPER, UCB-ITS-VWP-2008-2, University of California, Berkeley.
Source: Mikhail Chester and Arpad Horvath 2008 Environmental Life-cycle Assessment of Passenger Transportation: A Detailed Methodology for Energy, Greenhouse Gas, and Criteria Pollutant Inventories of Automobiles, Buses, Light Rail, Heavy Rail and Air. WORKING PAPER, UCB-ITS-VWP-2008-2, University of California, Berkeley.
IIT Delhi 20-01-2014
10
19.7 22.0 10.3 9.7 22.9 104.1 118.2 101.0
0.0 20.0 40.0 60.0 80.0 100.0 120.0 140.0
Metro rail (Phase 2) Metro rail (Phase 1) Diesel bus (BRT) CNG Bus (BRT) TW Petrol car Diesel car CNG car
CO2 emissions (g/PKM)
Source: TERI, 2013
20th CENTURY SOLUTIONS: One way streets? Road widening & expansion? Flyovers, elevated/underground corridors? Metro/LRT/Monorail/Skybus - providing corridor capacity to serve link demand Underground trains seen as a major solution during cold war as nuclear shelters
IIT Delhi20-01-2014
“One-way streets reflect the dominance of the car and the failed go-faster policies of the traffic engineers. As we begin to realise that walking and cycling should be the dominant forms of transport, the one-way street should be consigned to the dustbin of history.”
Peter Murray, Head of the New London Architecture Centre,
IIT Delhi 20-01-2014
12
WHO (2009) Global status report on road safety: time for action, World Health Organization, Geneva.
Factor of 4
1 3
100 1000 10000 100000 Country per capita income, USD per year 100 200 300 400 Fatalities, persons per million population
ADD MPM MDL CGP ACC NBO DAC PVG CCU BLR BOM PNQ AMD MAA DEL IXC DKR MNL BOG BKK CLO PLZ BFN PRY CPT JNB CGK DUR GRU KUL HIW KIX TYO OSA LAX HOU WAS CHI NYC BOS DTT DEN SFO PHX HKG VIE MVC SIN BRU PAR LON MEL PER ADL SYD BNE DXB TPE SEL RUH MEX
IIT Delhi 20-01-2014
14
Years 2004-2008, population > 20,000 persons
IIT Delhi 20-01-2014
1 5
IIT Delhi 20-01-2014
1 6
IIT Delhi 20-01-2014
Proportion of fatalities on roads with different total lanes available in Chicago (low fatality rate ) and Dallas (high fatality rate)
17
IIT Delhi 20-01-2014
IIT Delhi 7 March 2012
1 8
IIT Delhi 7 March 2012
19
IIT Delhi 7 March 2012
2
IIT Delhi 7 March 2012
21
Source: N. Garrick
IIT Delhi 20-01-2014
Possibilities to reduce CO2 emissions from road traffic for urban planners seem limited: a restriction of space dedicated to traffic and a change of transport means for commuting represent leverage points.
Reckien,D., Ewald,M., Edenhofer,O., & Ludeke,M.K.B. (2007). What Parameters Influence the Spatial Variations in CO2 Emissions from Road Traffic in Berlin? Implications for Urban Planning to Reduce Anthropogenic CO2
The results suggest that public transport users could achieve dramatic savings on their commute if the density of that network was increased considerably
Murphy,E. (2009). Excess commuting and modal choice. Transportation Research Part A: Policy and Practice, 43(8), 735-743.
Current urban policy, which relies predominantly on ambitious and expensive programmes of transport infrastructure provision must be rethought in Beijing
ZHAO, P., LU, B. & LINDEN, G. J. J. (2009) The effects of transport accessibility and jobs and housing balance on commuting time: evidence from beijing. International planning studies, 14, (1) 65-83.
High speed systems will further encourage sprawl and greater energy consumption, and hence, Public Transit (PT), even if the commercial speed is rather low, is probably the only way to improve urban accessibility and urban attractiveness in a sustainable way
CROZET, Y. Economic development and the role of travel time: the key concept of accessibility, Gothenberg: Volvo Research & Educational Foundations, pp. 1-22.
20 January 2014 IIT Delhi
IIT Delhi 20-01-2014
24